DKE 13.3 inch (DEPG1330RTE133F5HP)
Solid colors, dithered mixtures, and measurement setup for the DKE 13.3-inch Spectra 6 panel.
The DEPG1330RTE133F5HP is a 13.3-inch Spectra 6 panel with a 1600 × 1200 pixel test raster. We measured its six solid colors and 45 dithered mixtures using a camera and a Spyder Checkr 24 reference card.
These are camera-based estimates under the test lighting. See the Panels overview for the shared setup, method, and how to read the swatches.
Setup
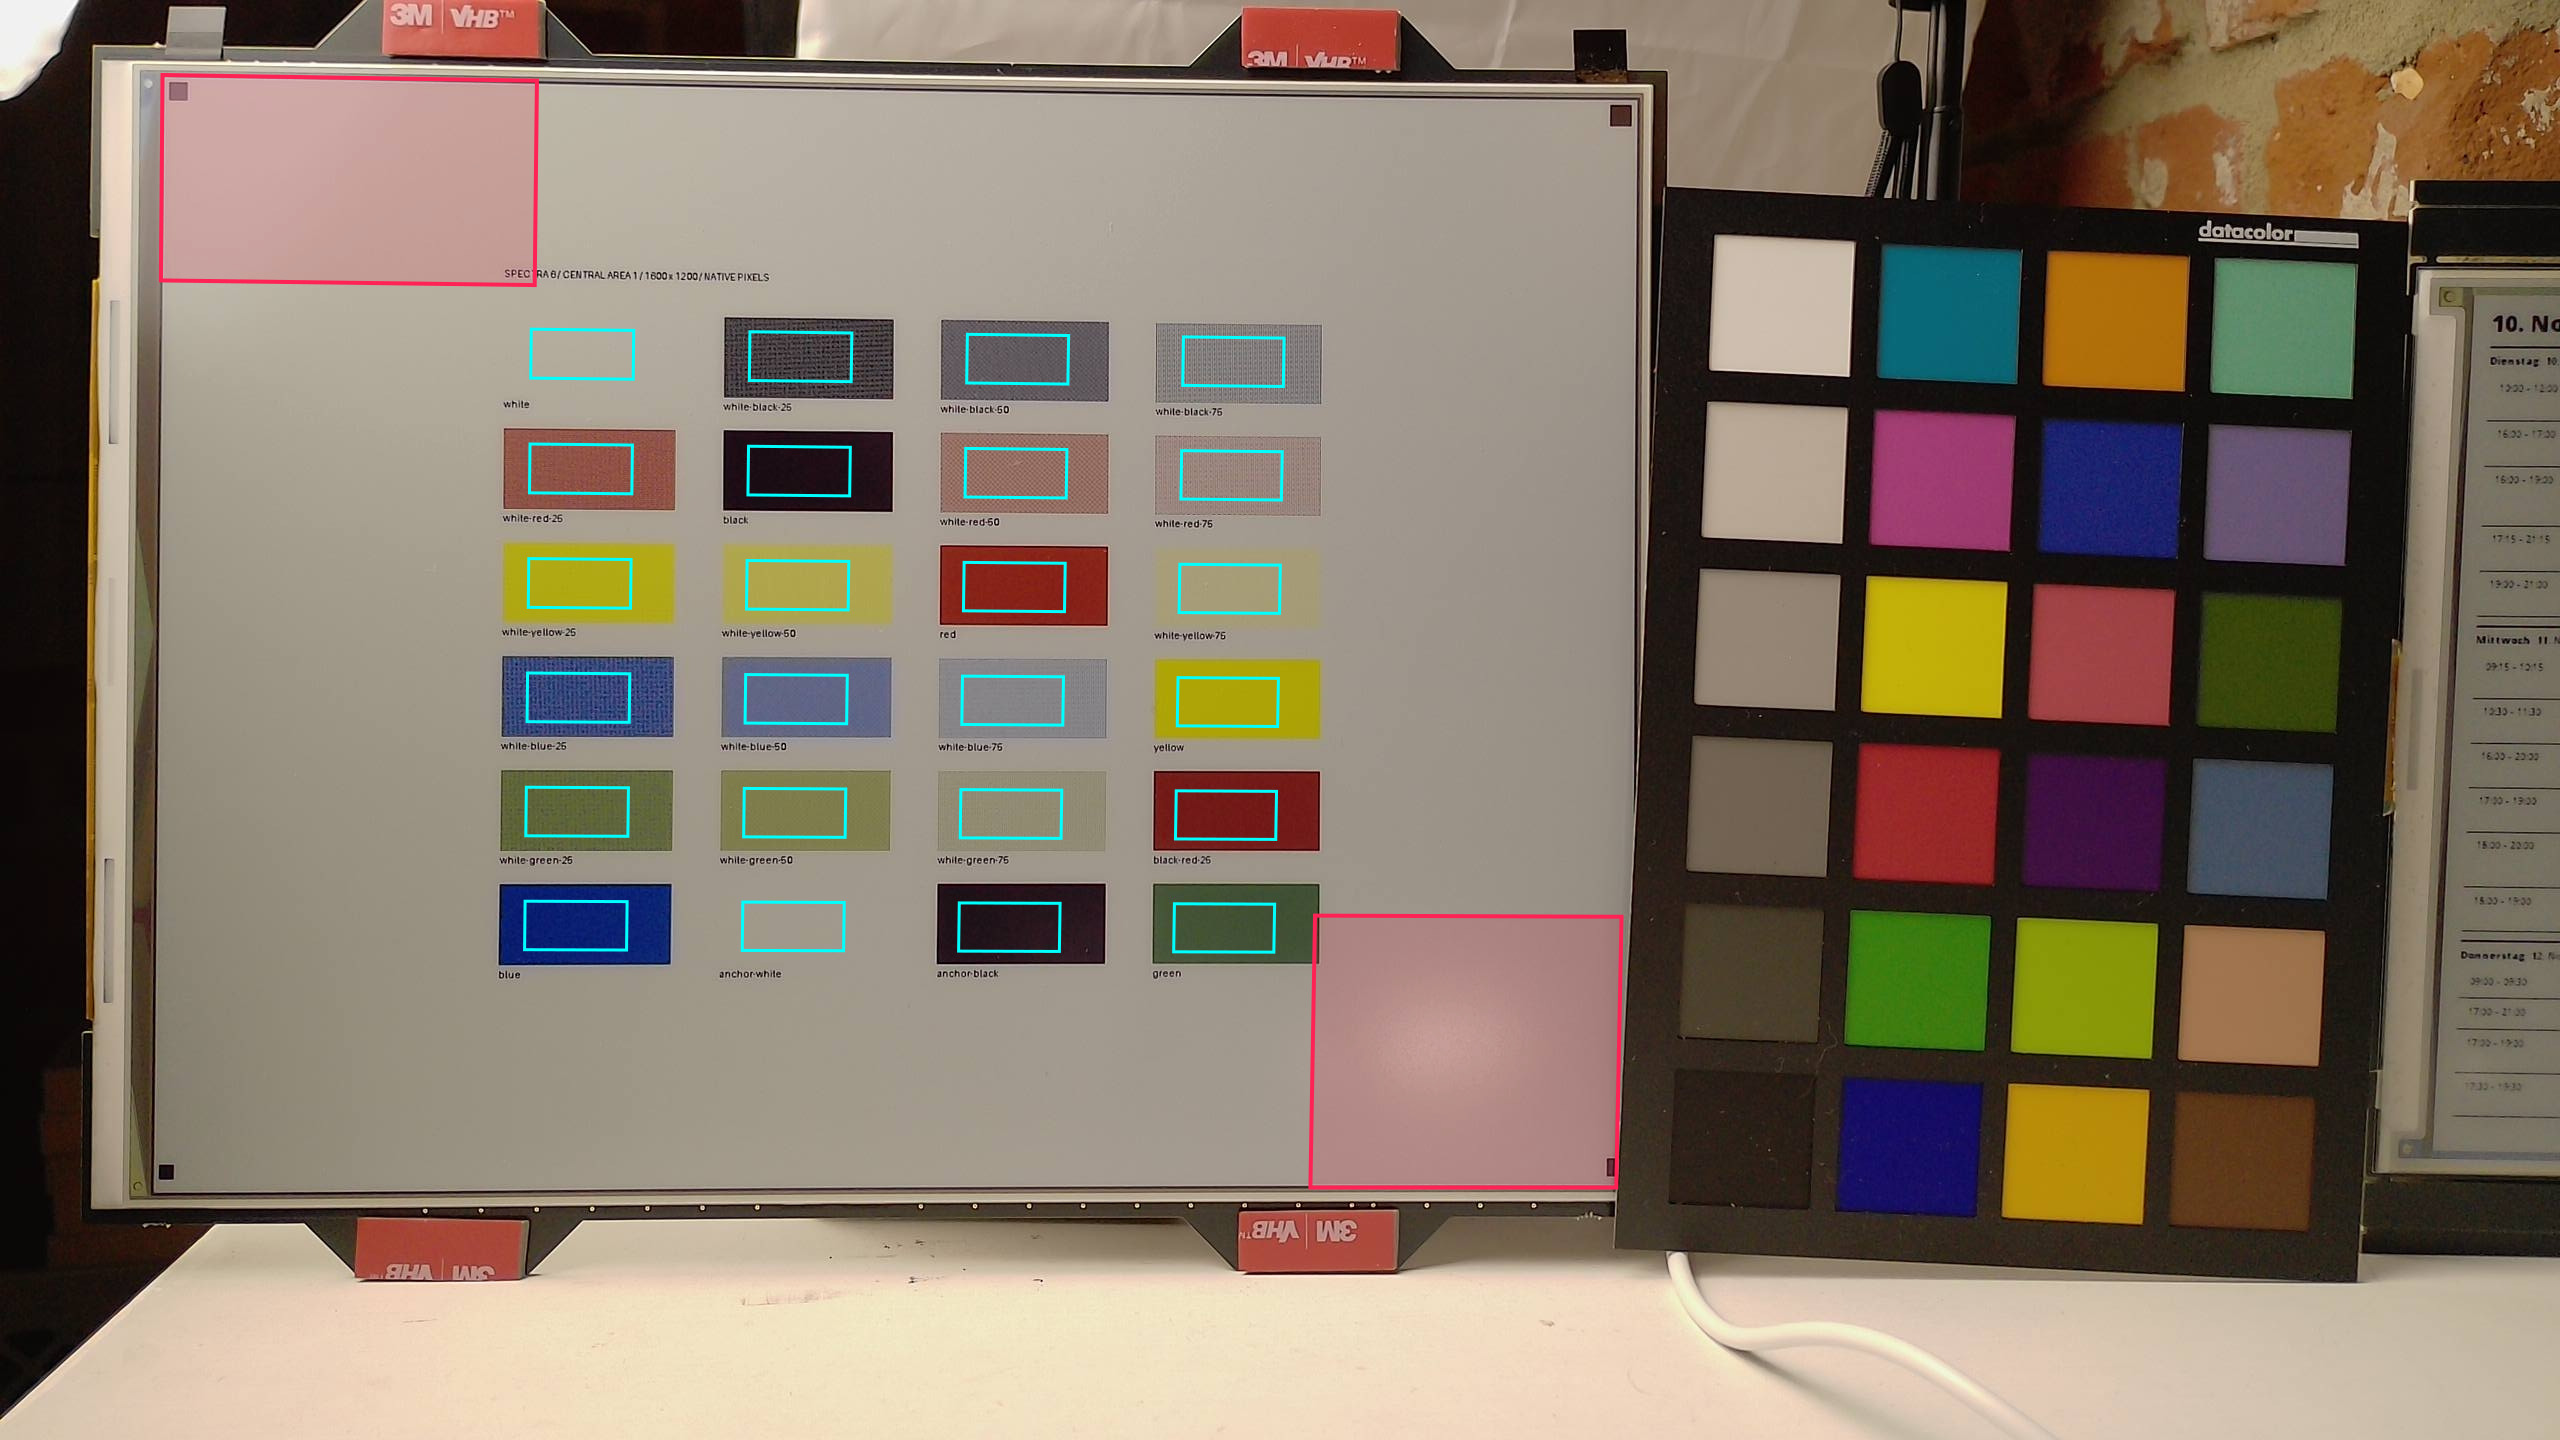
The 13.3-inch panel sits to the left of the reference card on the shared bench. The measurement charts were moved toward the center to avoid reflections at the corners.
Solid colors
Each color was measured at three positions near the center of the panel. The swatches show the average. The input code is the RGB value sent to the panel: #FF0000, for example, produced the red measured here as #A3212C.
#C0C0C5- sRGB
- 192, 192, 197
- Lab
- 77.9 / 0.9 / -2.6
- Input code
- #FFFFFF
- Max. position ΔE₀₀
- 3.12
#212A39- sRGB
- 33, 42, 57
- Lab
- 16.8 / 1.0 / -11.2
- Input code
- #000000
- Max. position ΔE₀₀
- 4.28
#A3212C- sRGB
- 163, 33, 44
- Lab
- 36.1 / 52.2 / 27.9
- Input code
- #FF0000
- Max. position ΔE₀₀
- 2.37
#CFBF21- sRGB
- 207, 191, 33
- Lab
- 76.5 / -9.8 / 72.7
- Input code
- #FFFF00
- Max. position ΔE₀₀
- 0.61
#0757AD- sRGB
- 7, 87, 173
- Lab
- 37.6 / 12.7 / -51.6
- Input code
- #0000FF
- Max. position ΔE₀₀
- 1.25
#4E6B58- sRGB
- 78, 107, 88
- Lab
- 42.5 / -14.9 / 7.3
- Input code
- #00FF00
- Max. position ΔE₀₀
- 2.40
Reflections and field positions
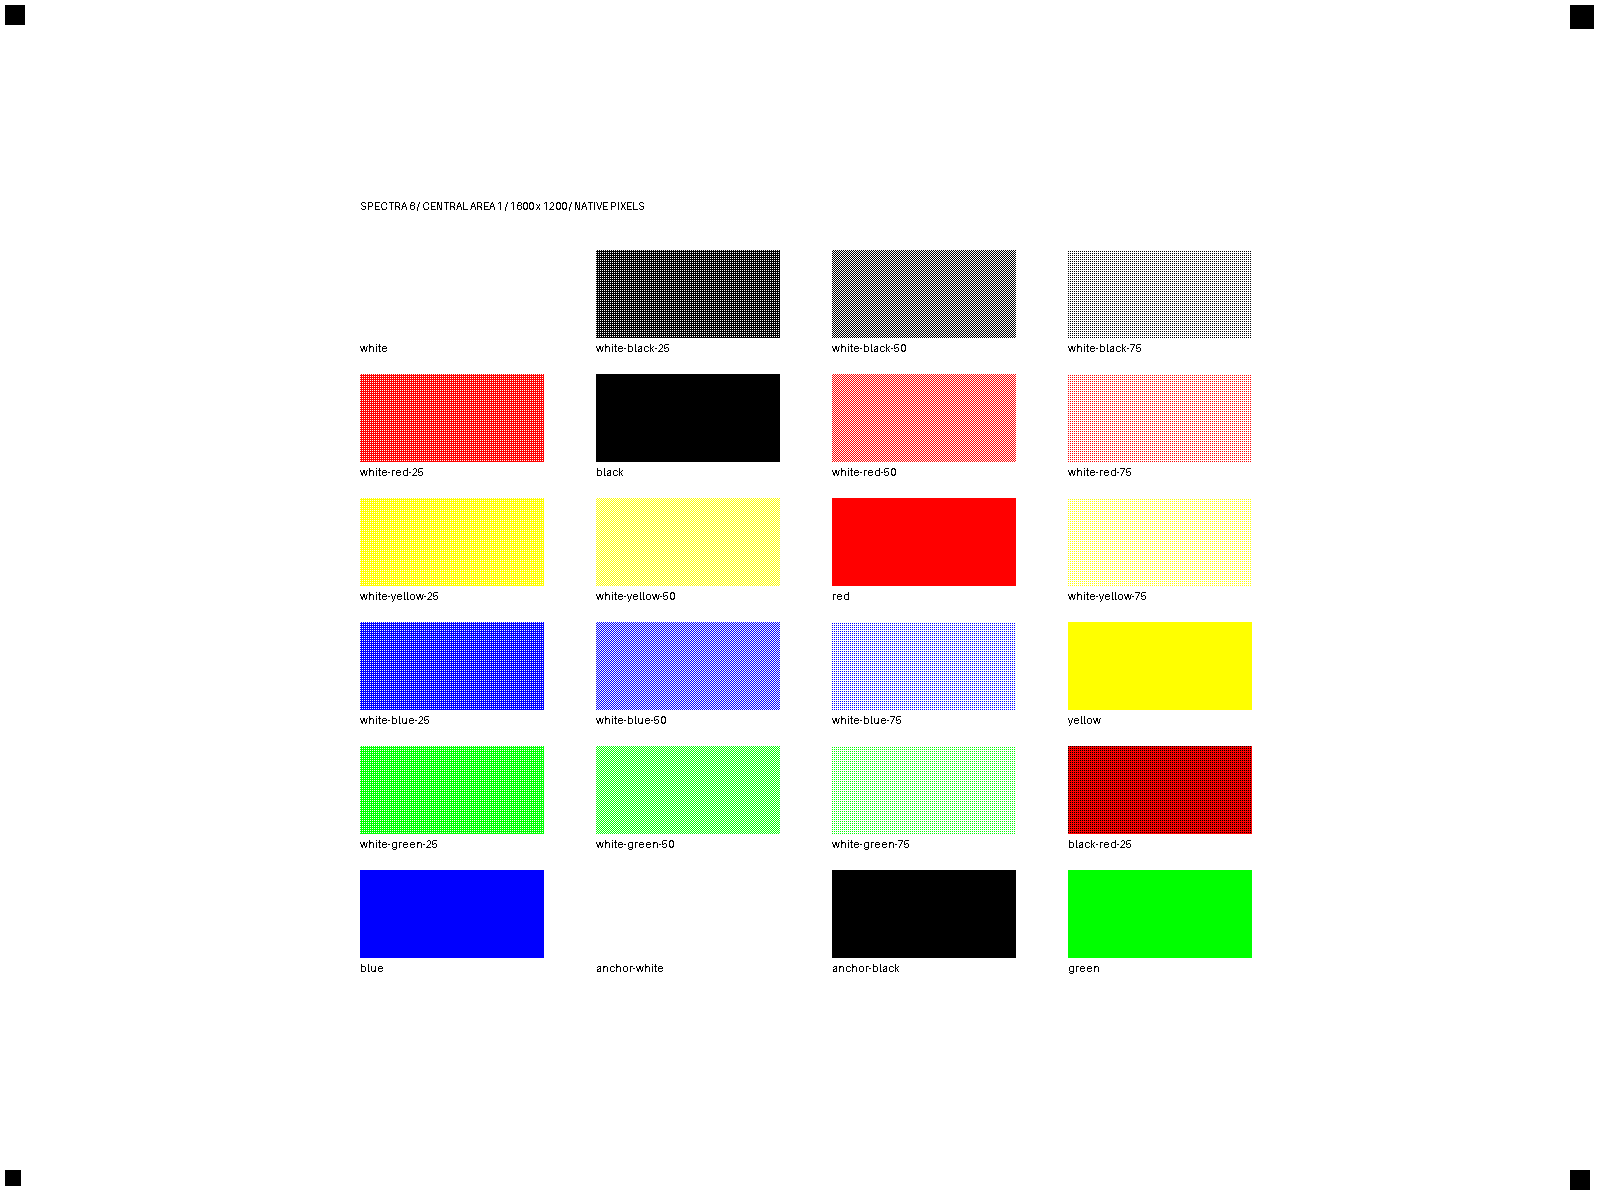
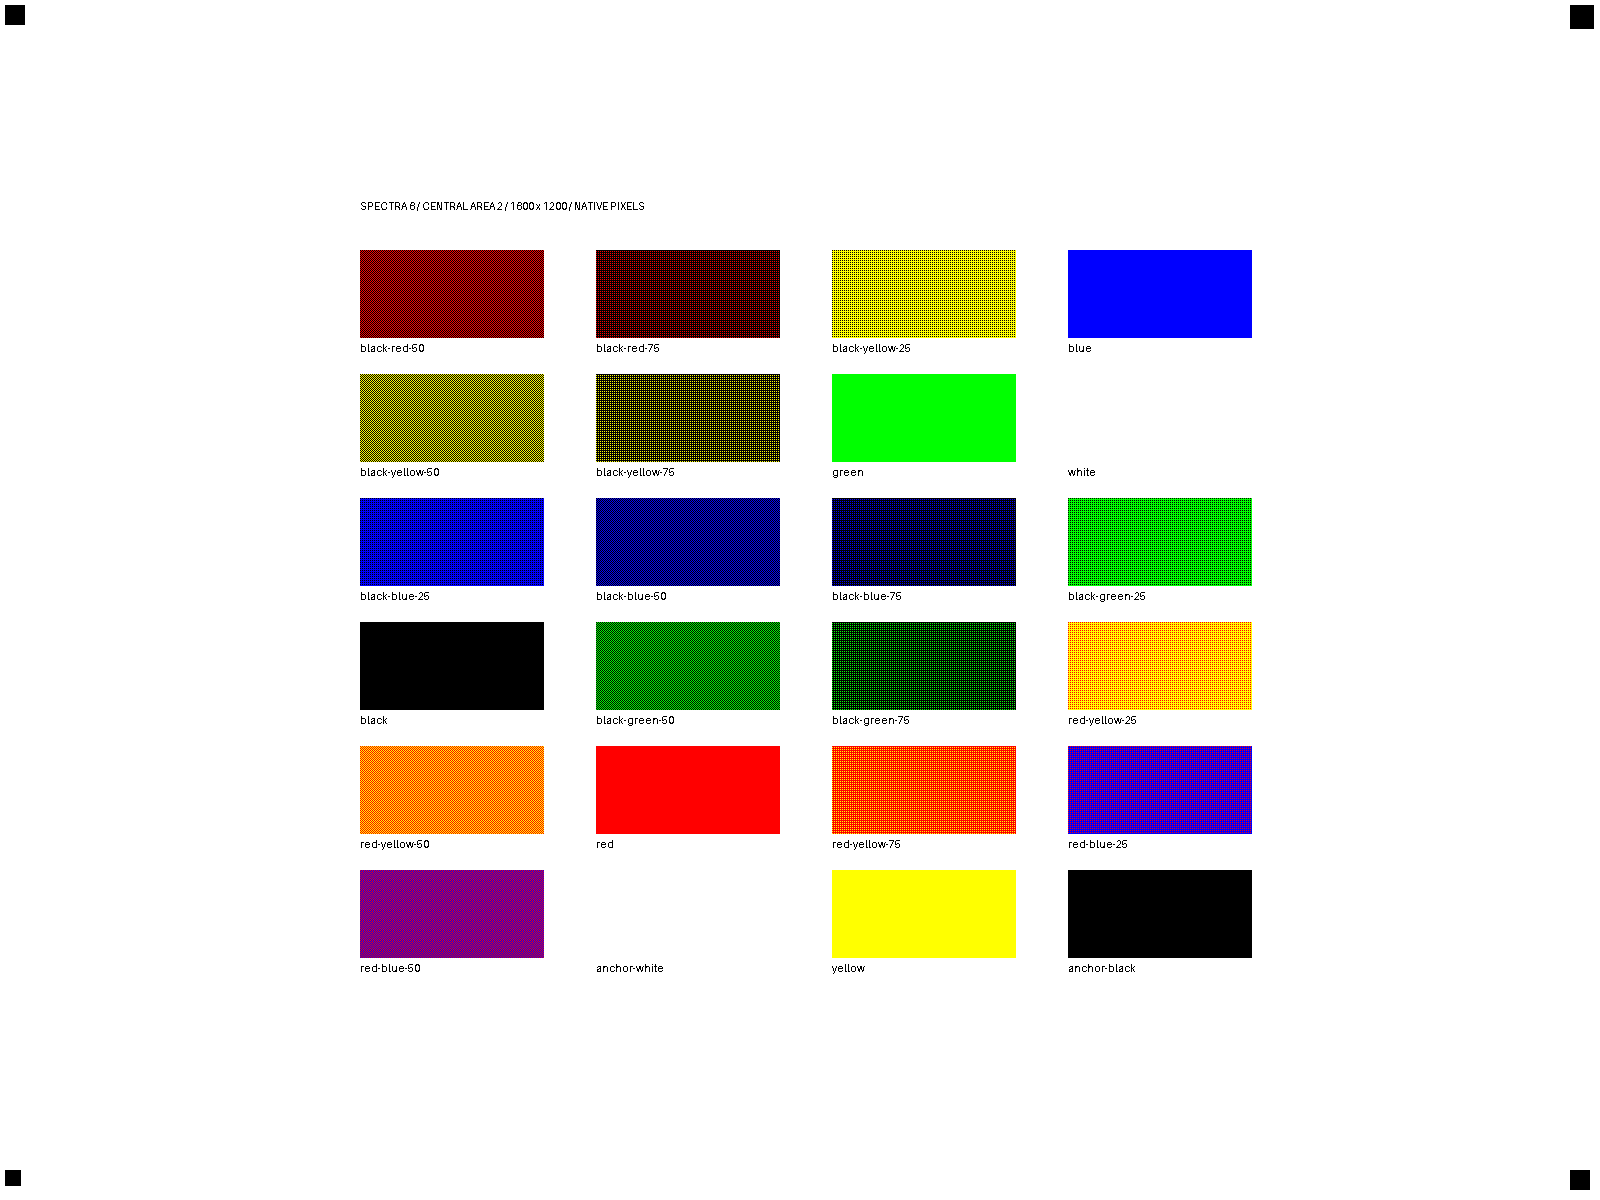
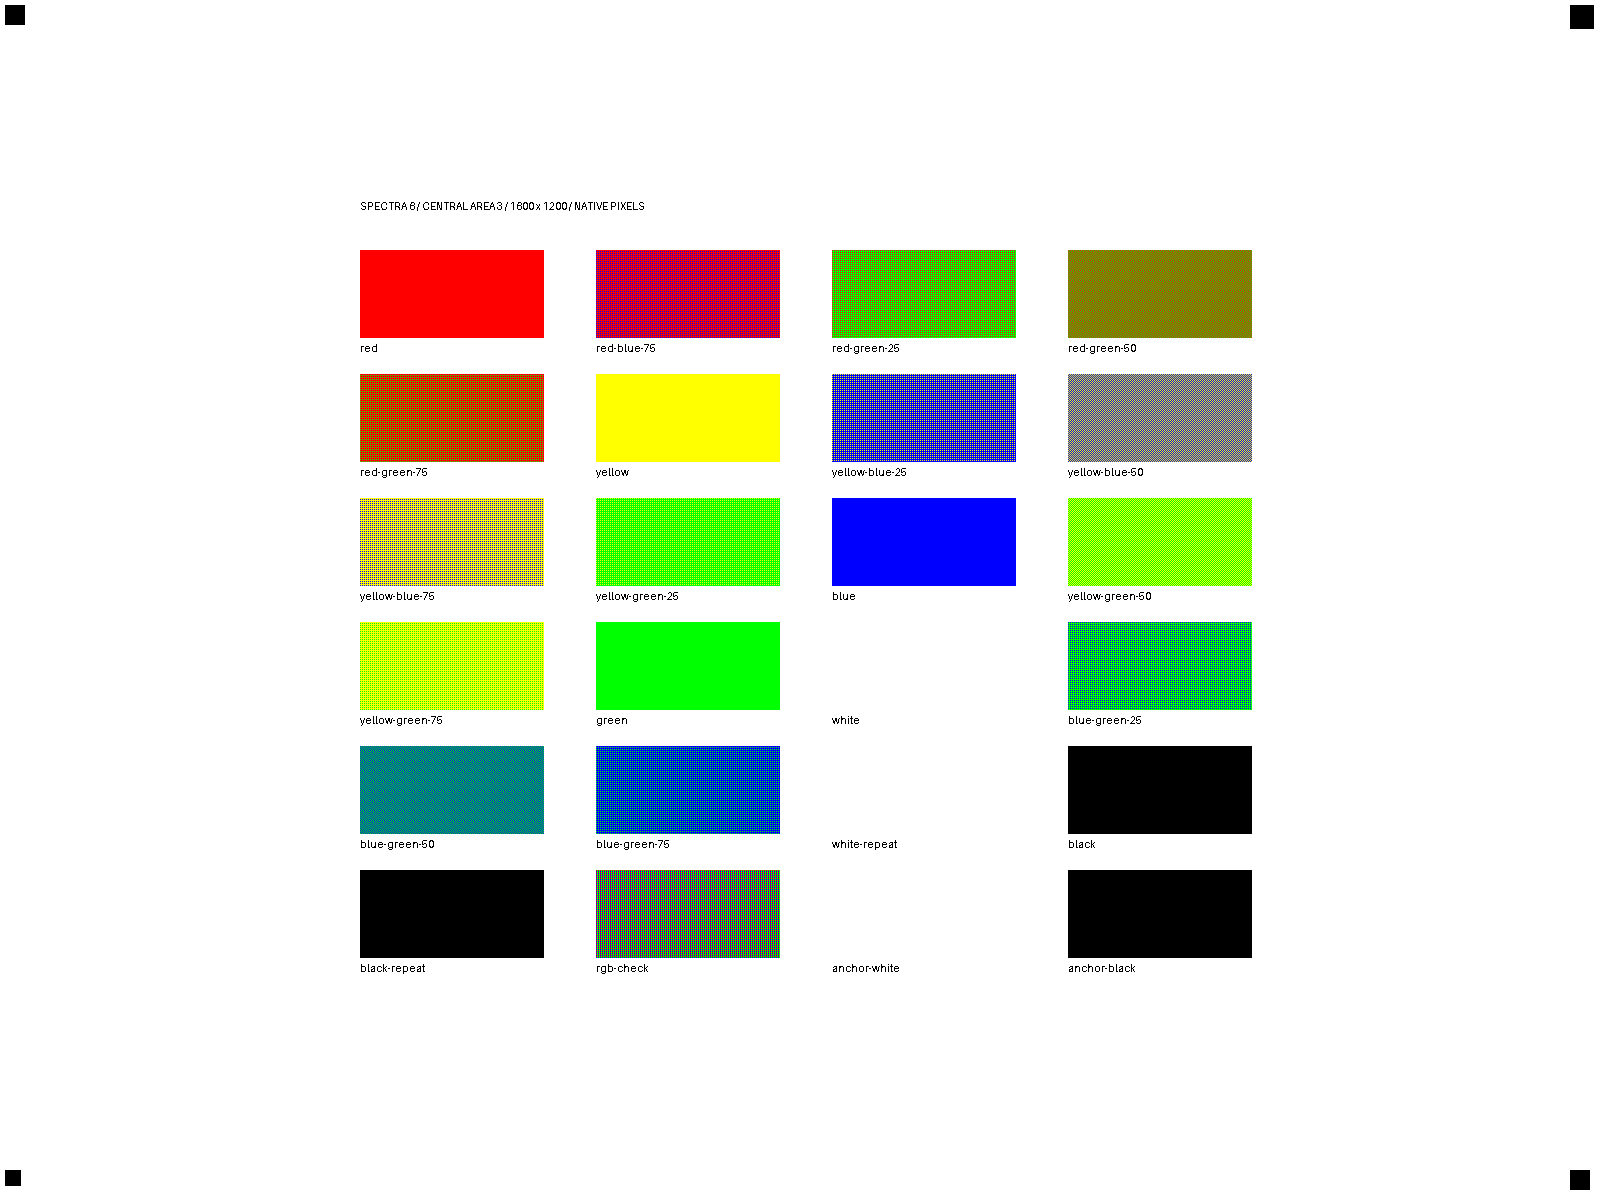
The first charts covered most of the panel and caught reflections in the upper-left and lower-right corners. We repeated the measurements with smaller fields near the center: three charts of 24 fields, within x = 360–1252 and y = 250–958 in panel pixels.
Each chart places the six solid colors in different positions. Together, the charts cover all 45 two-color mixtures, plus white, black, and three-color controls.
| Check | Original layout | Central layout |
|---|---|---|
| Mean solid-color position difference | 4.32 ΔE₀₀, two positions | 1.62 ΔE₀₀, three position pairs per color |
| Largest solid-color position difference | — | 4.28 ΔE₀₀ |
| Brightest / darkest sampled location in the white image | 1.96× | 1.34× |
| Reference-card cross-validation, mean | About 4.7 ΔE₀₀ | About 4.5 ΔE₀₀ |
Moving the fields improved agreement between positions. Because the layouts use different positions and sample counts, this is a repeatability check rather than a measure of absolute accuracy.
Sixteen observations from the original charts overlapped the reflection regions and were excluded from comparisons with the new fields. The original solid-color position statistic remains in the table as a baseline. The excluded rectangles are [0, 0, 400, 220] and [1260, 900, 1600, 1200], in [left, top, right, bottom] panel coordinates.
Mixtures
The 45 mixtures use the shared Bayer patterns. The mean area-model difference is 6.10 ΔE₀₀.
#4E505D#6D6F80#969BA9#A75D5F#AC8386#B4A3AB#CCC02C#CBBD6C#C5BEA7#416FAD#718BB9#9EA9BC#738061#979972#ADADA3#911F33#732635#562538#A89930#857231#5A4F3E#154B94#253F78#1D3152#4F5C48#564C3F#3D343D#C7A926#BF8E25#B4632D#3D5196#674F79#8F4163#766347#905C36#9B4331#687B99#9C9F80#B8B03A#7E893F#A3A42F#BBB22A#416469#306170#195D8FCamera captures
These are the original 2560 × 1440 JPEGs used in the measurement series, with no additional color correction or image optimization. Click a photo to open it at full size.
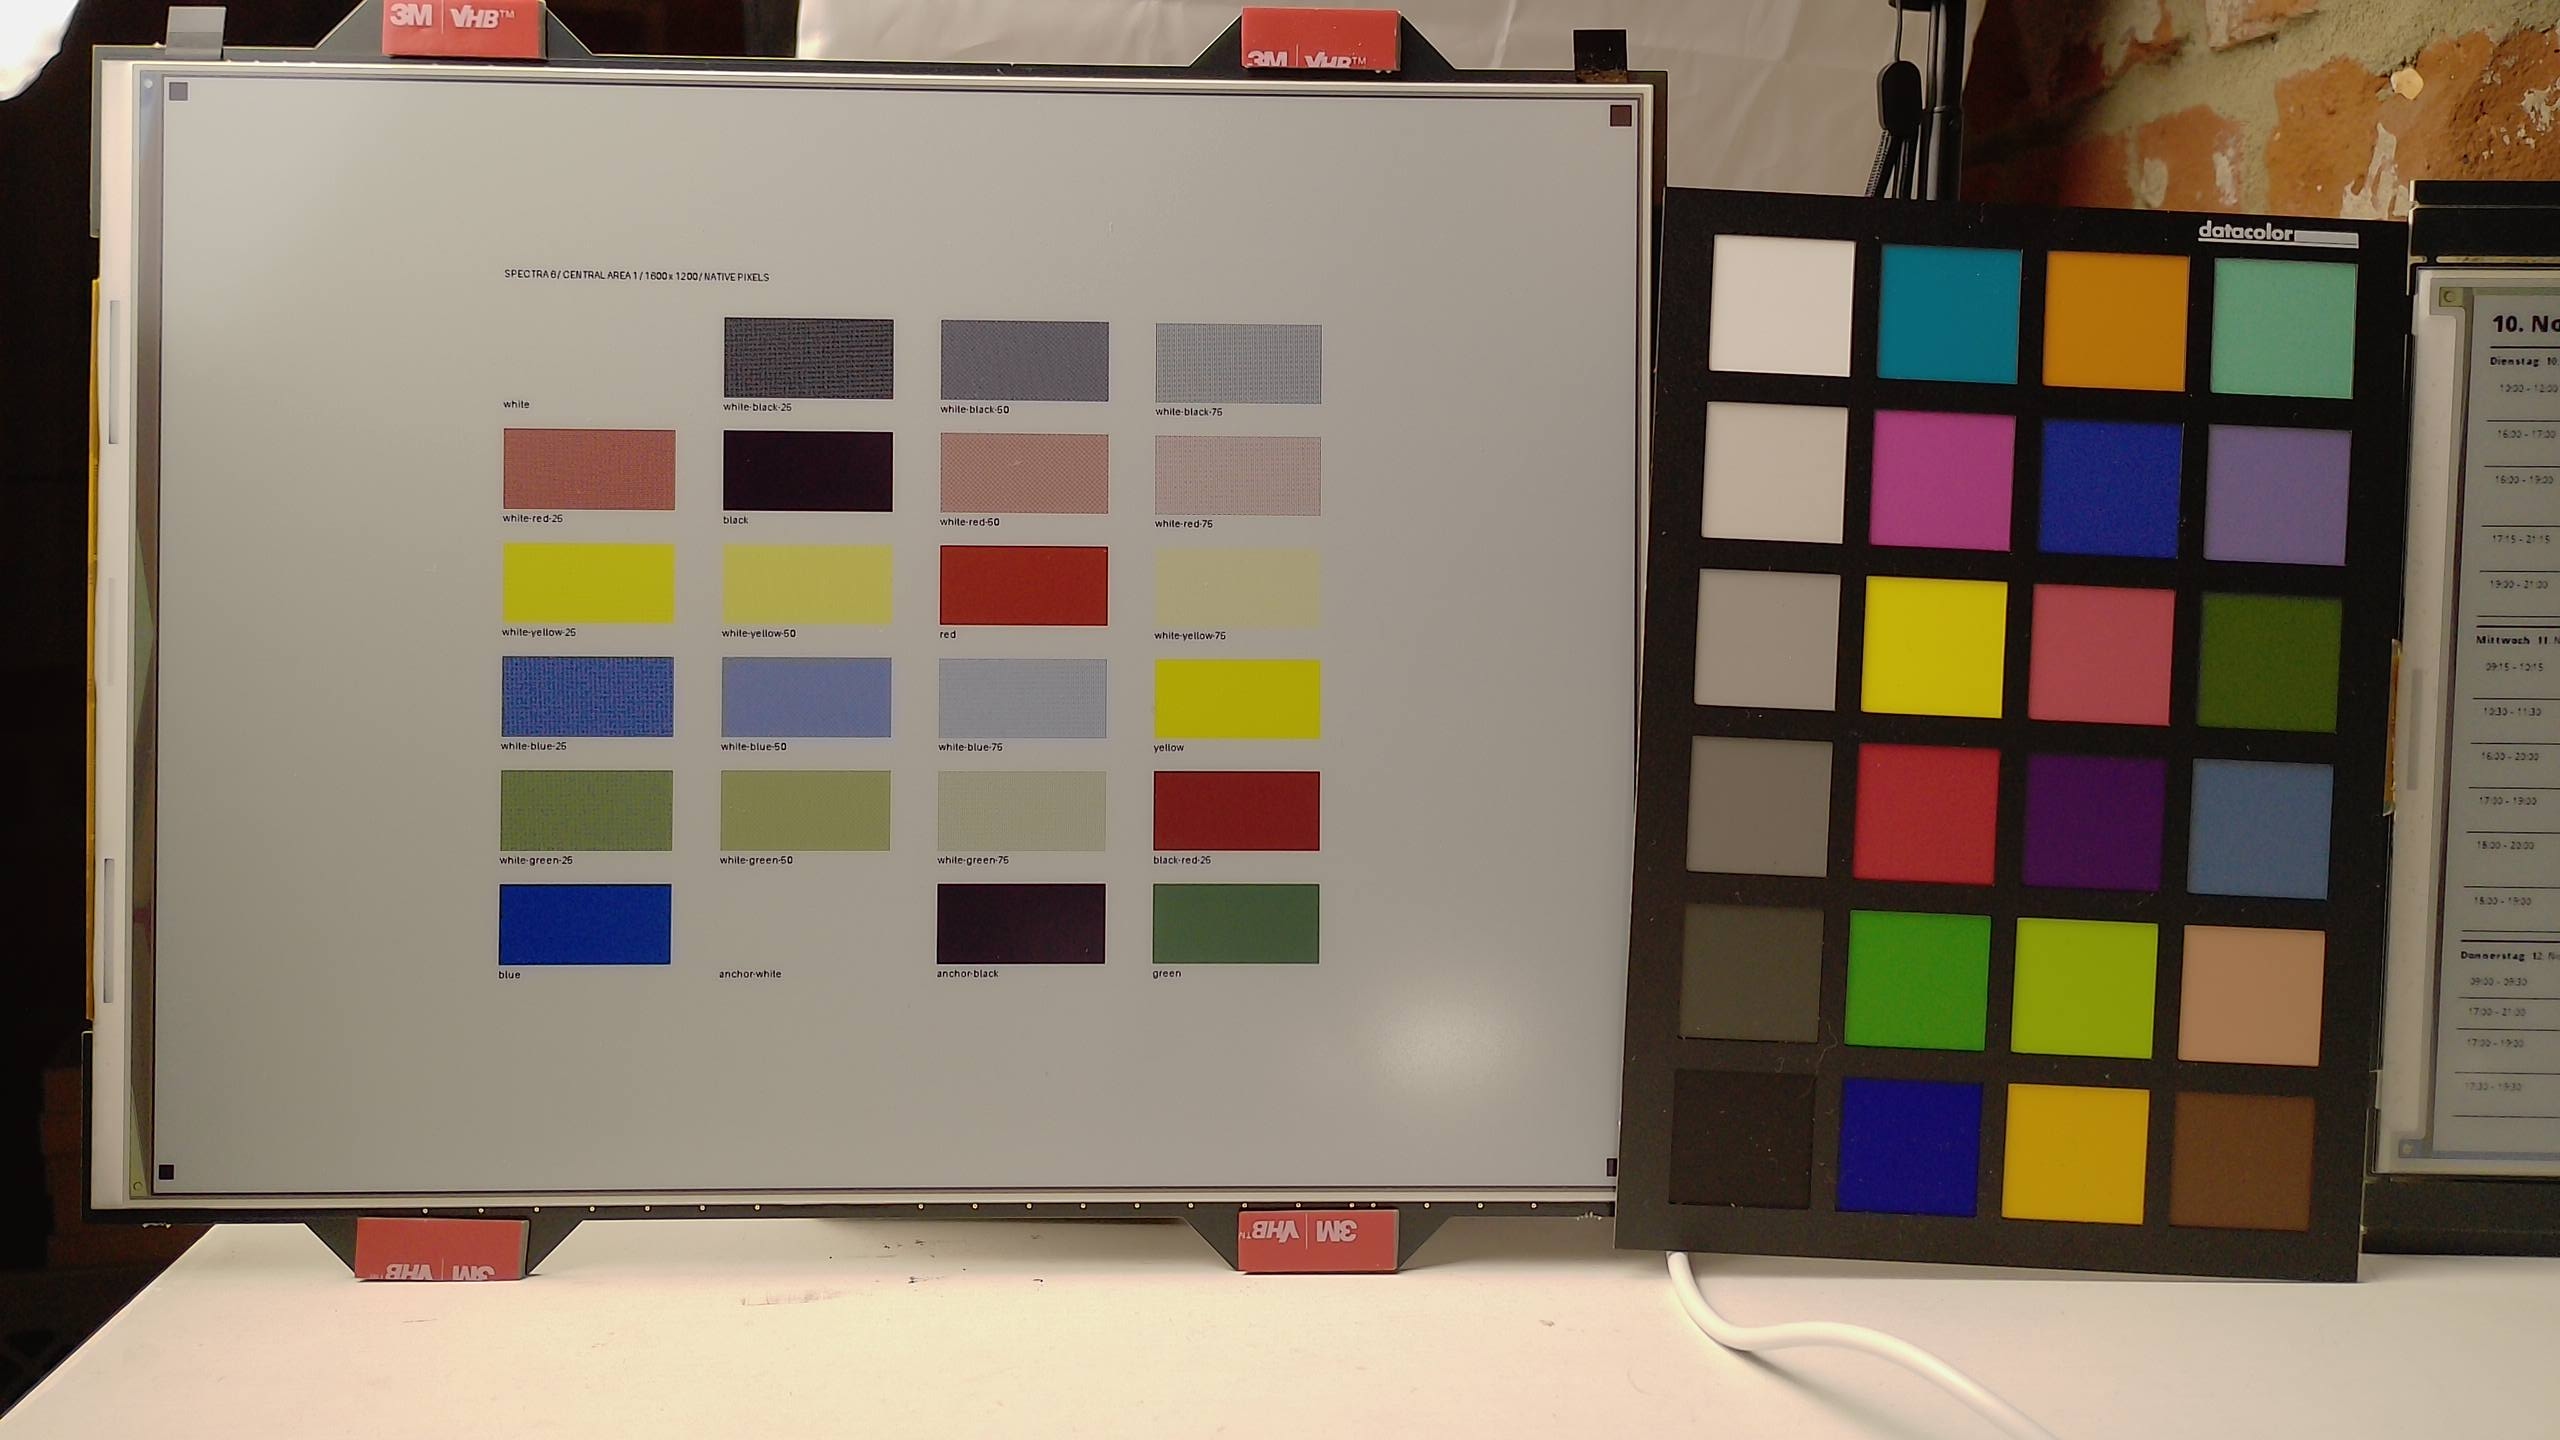
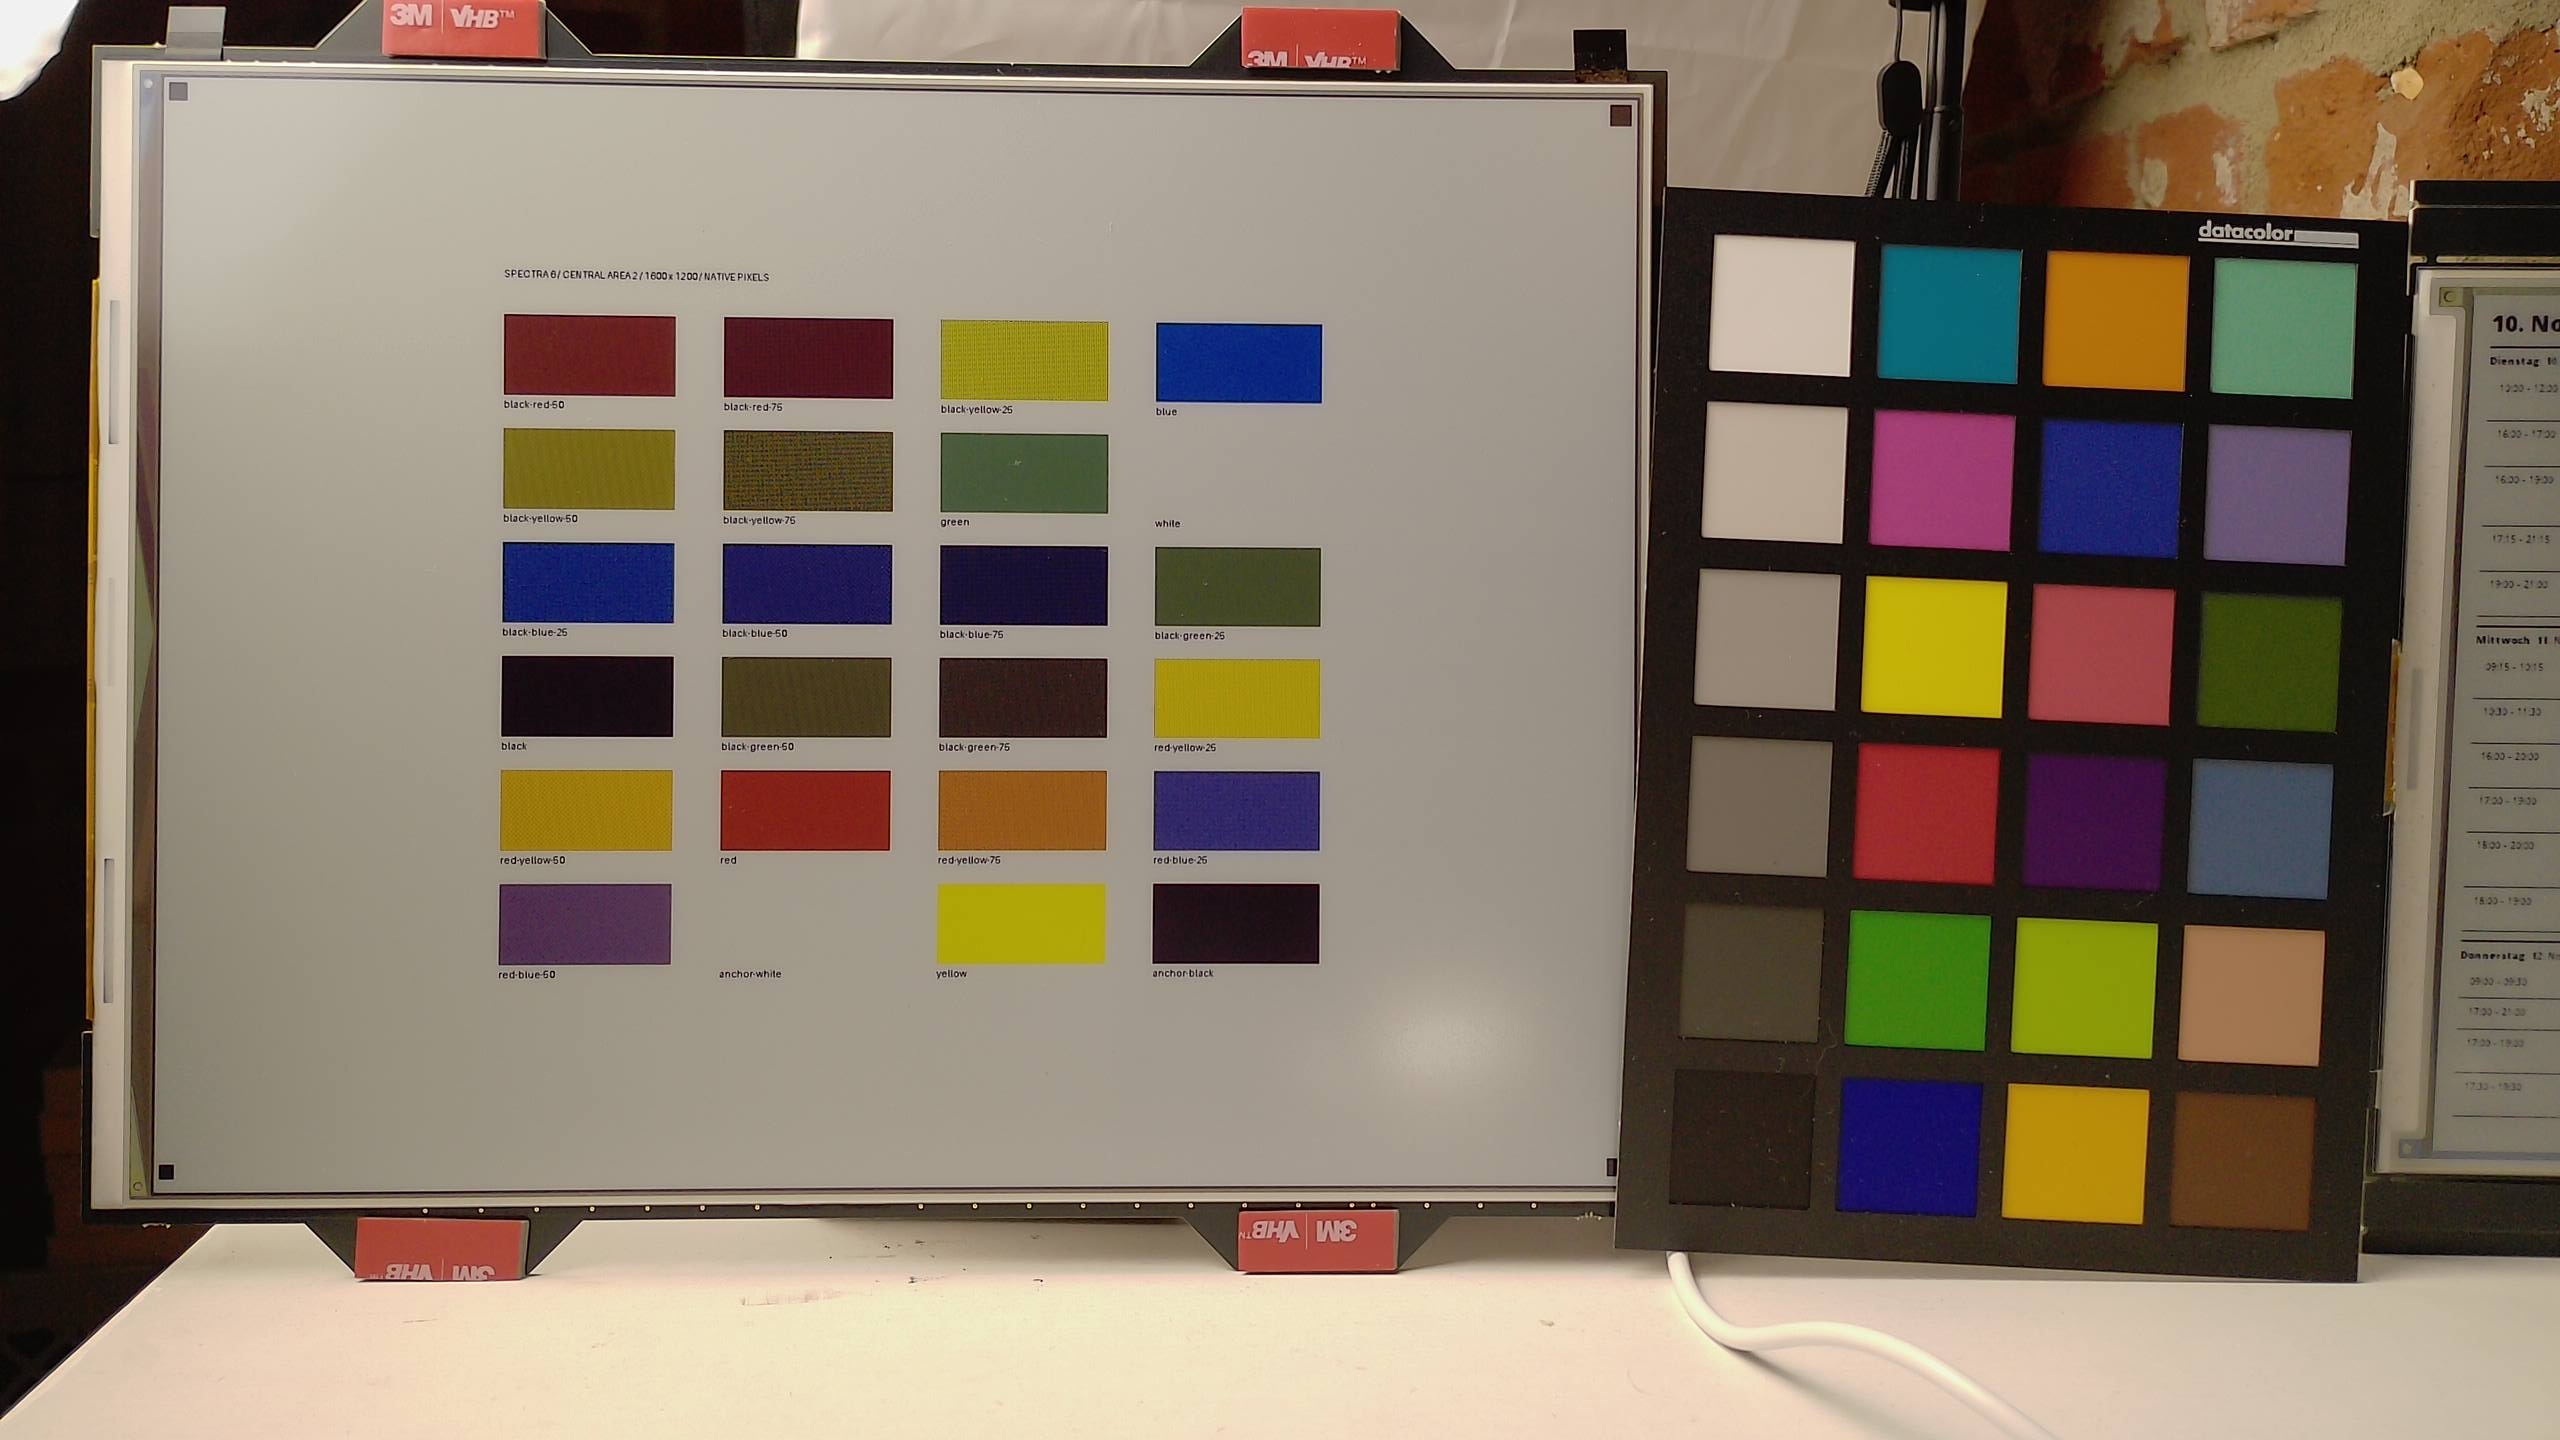
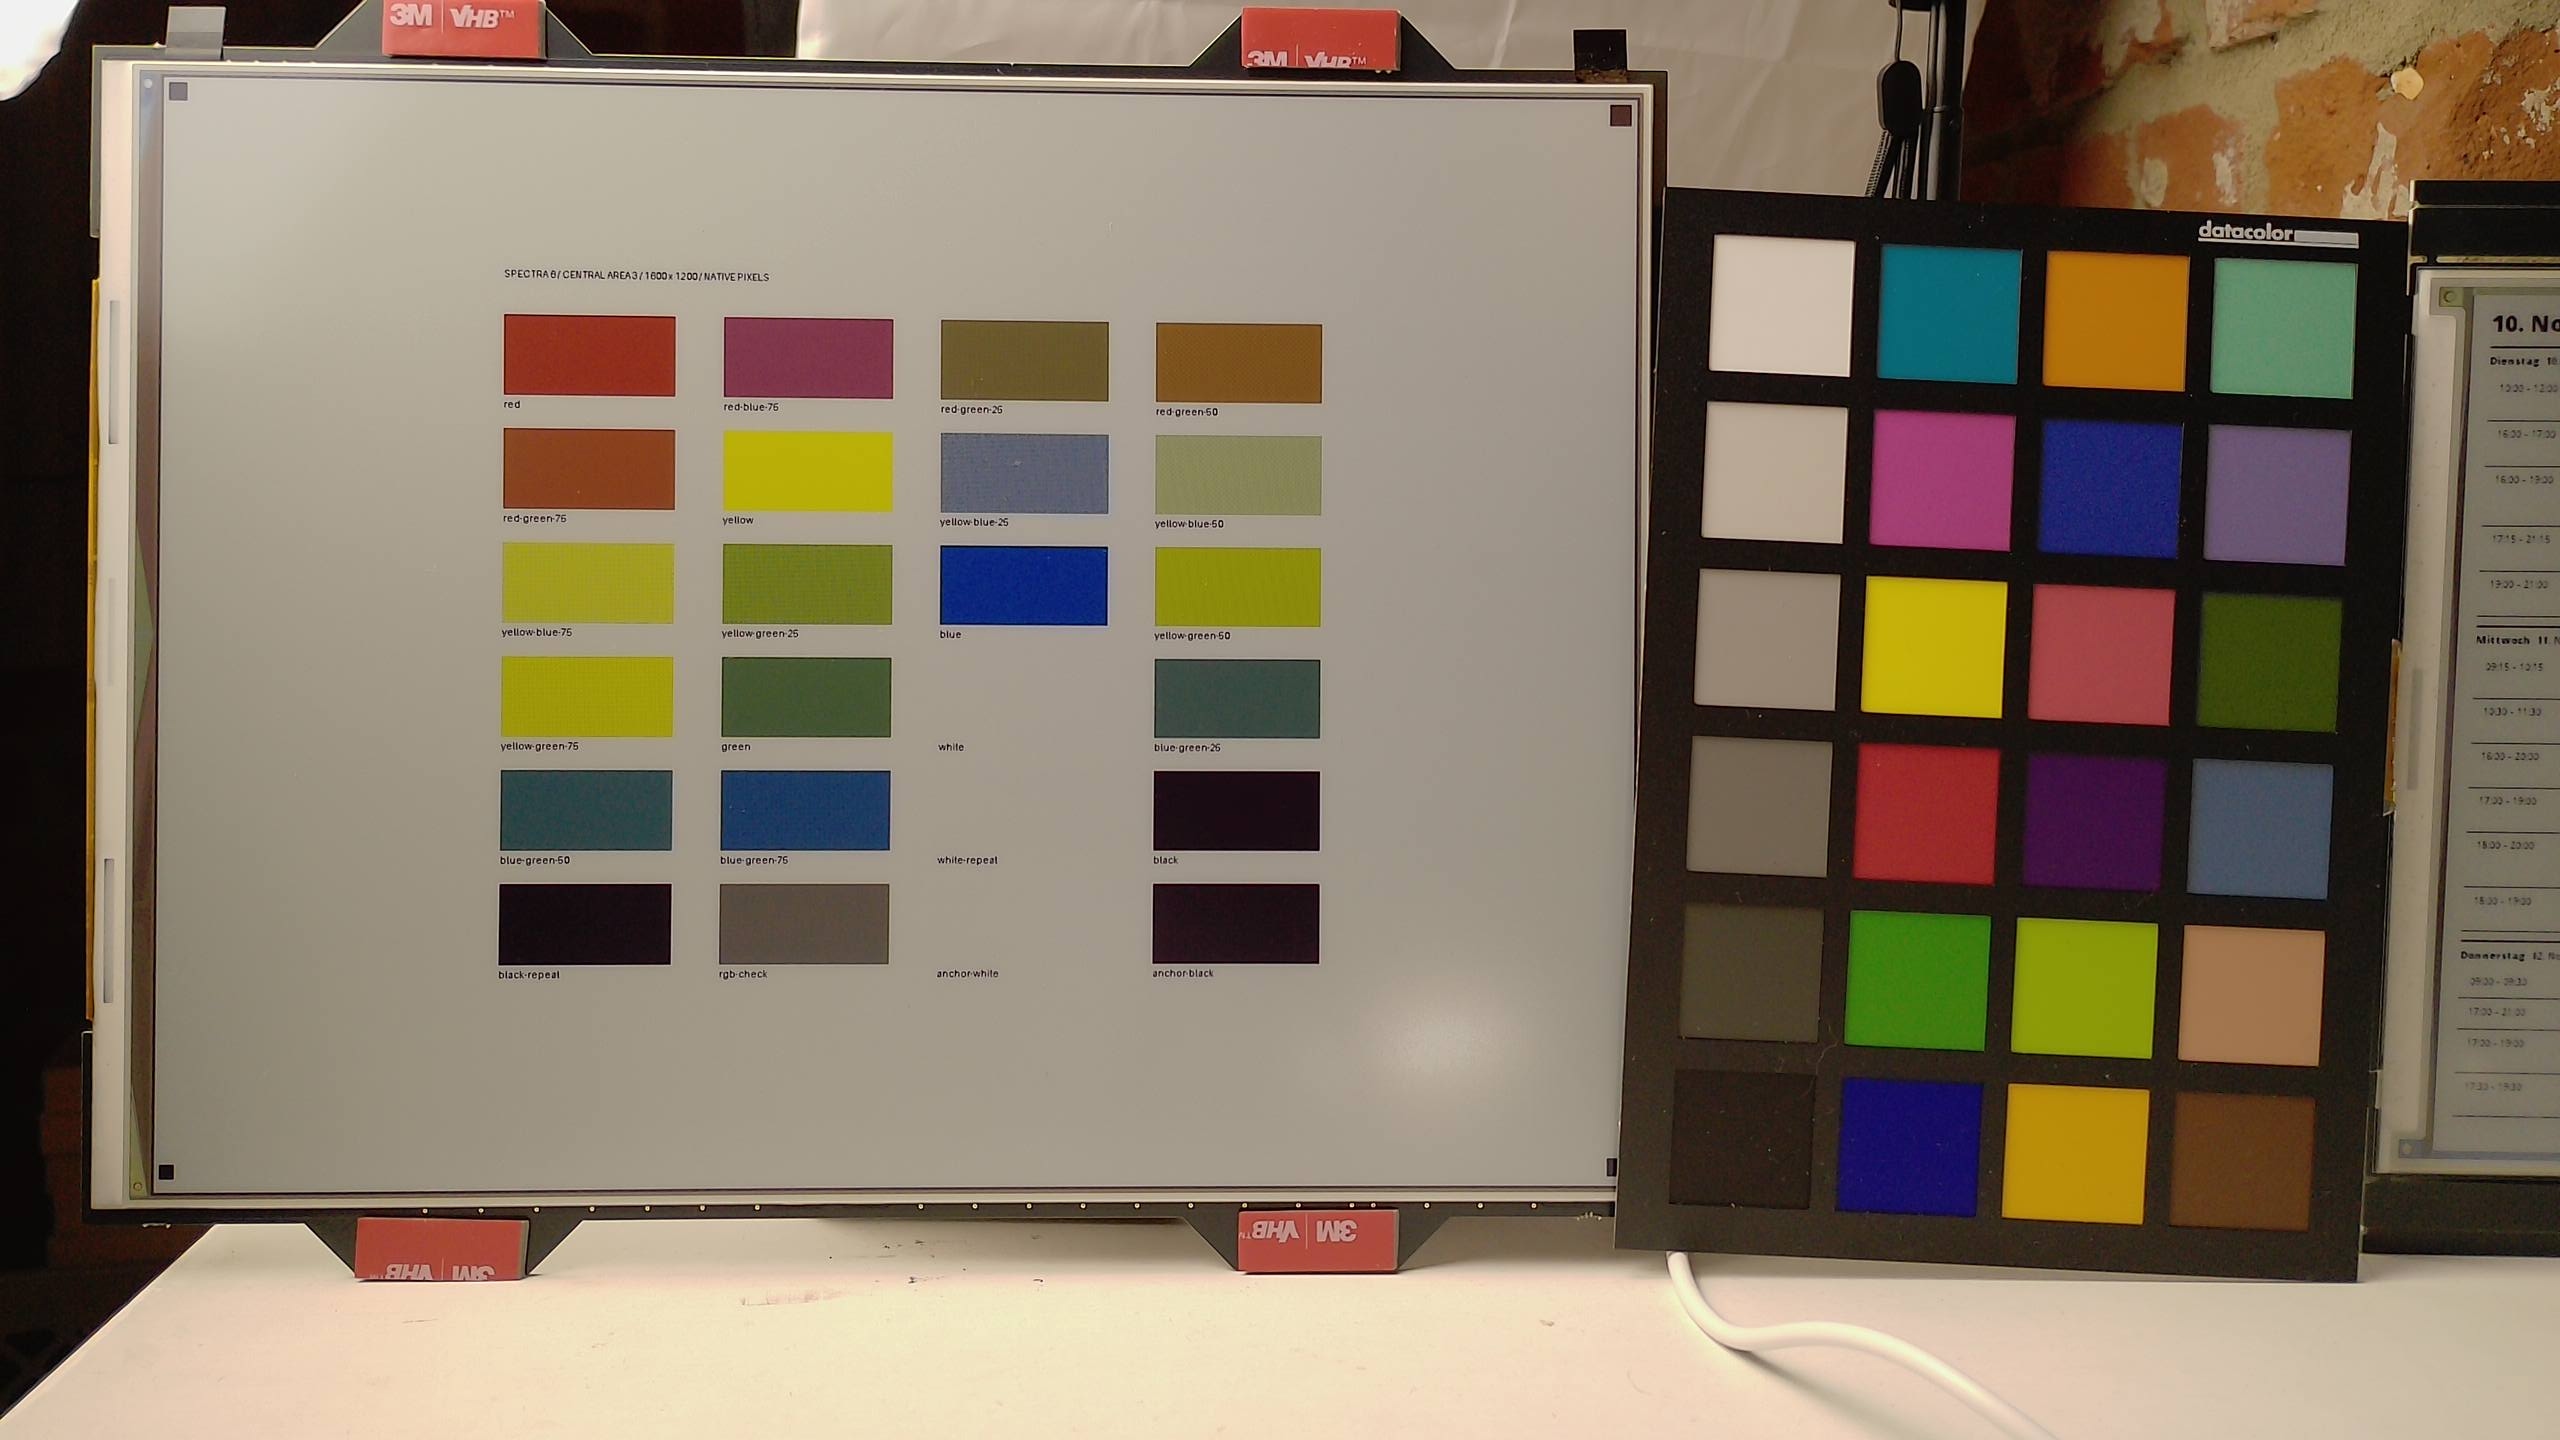
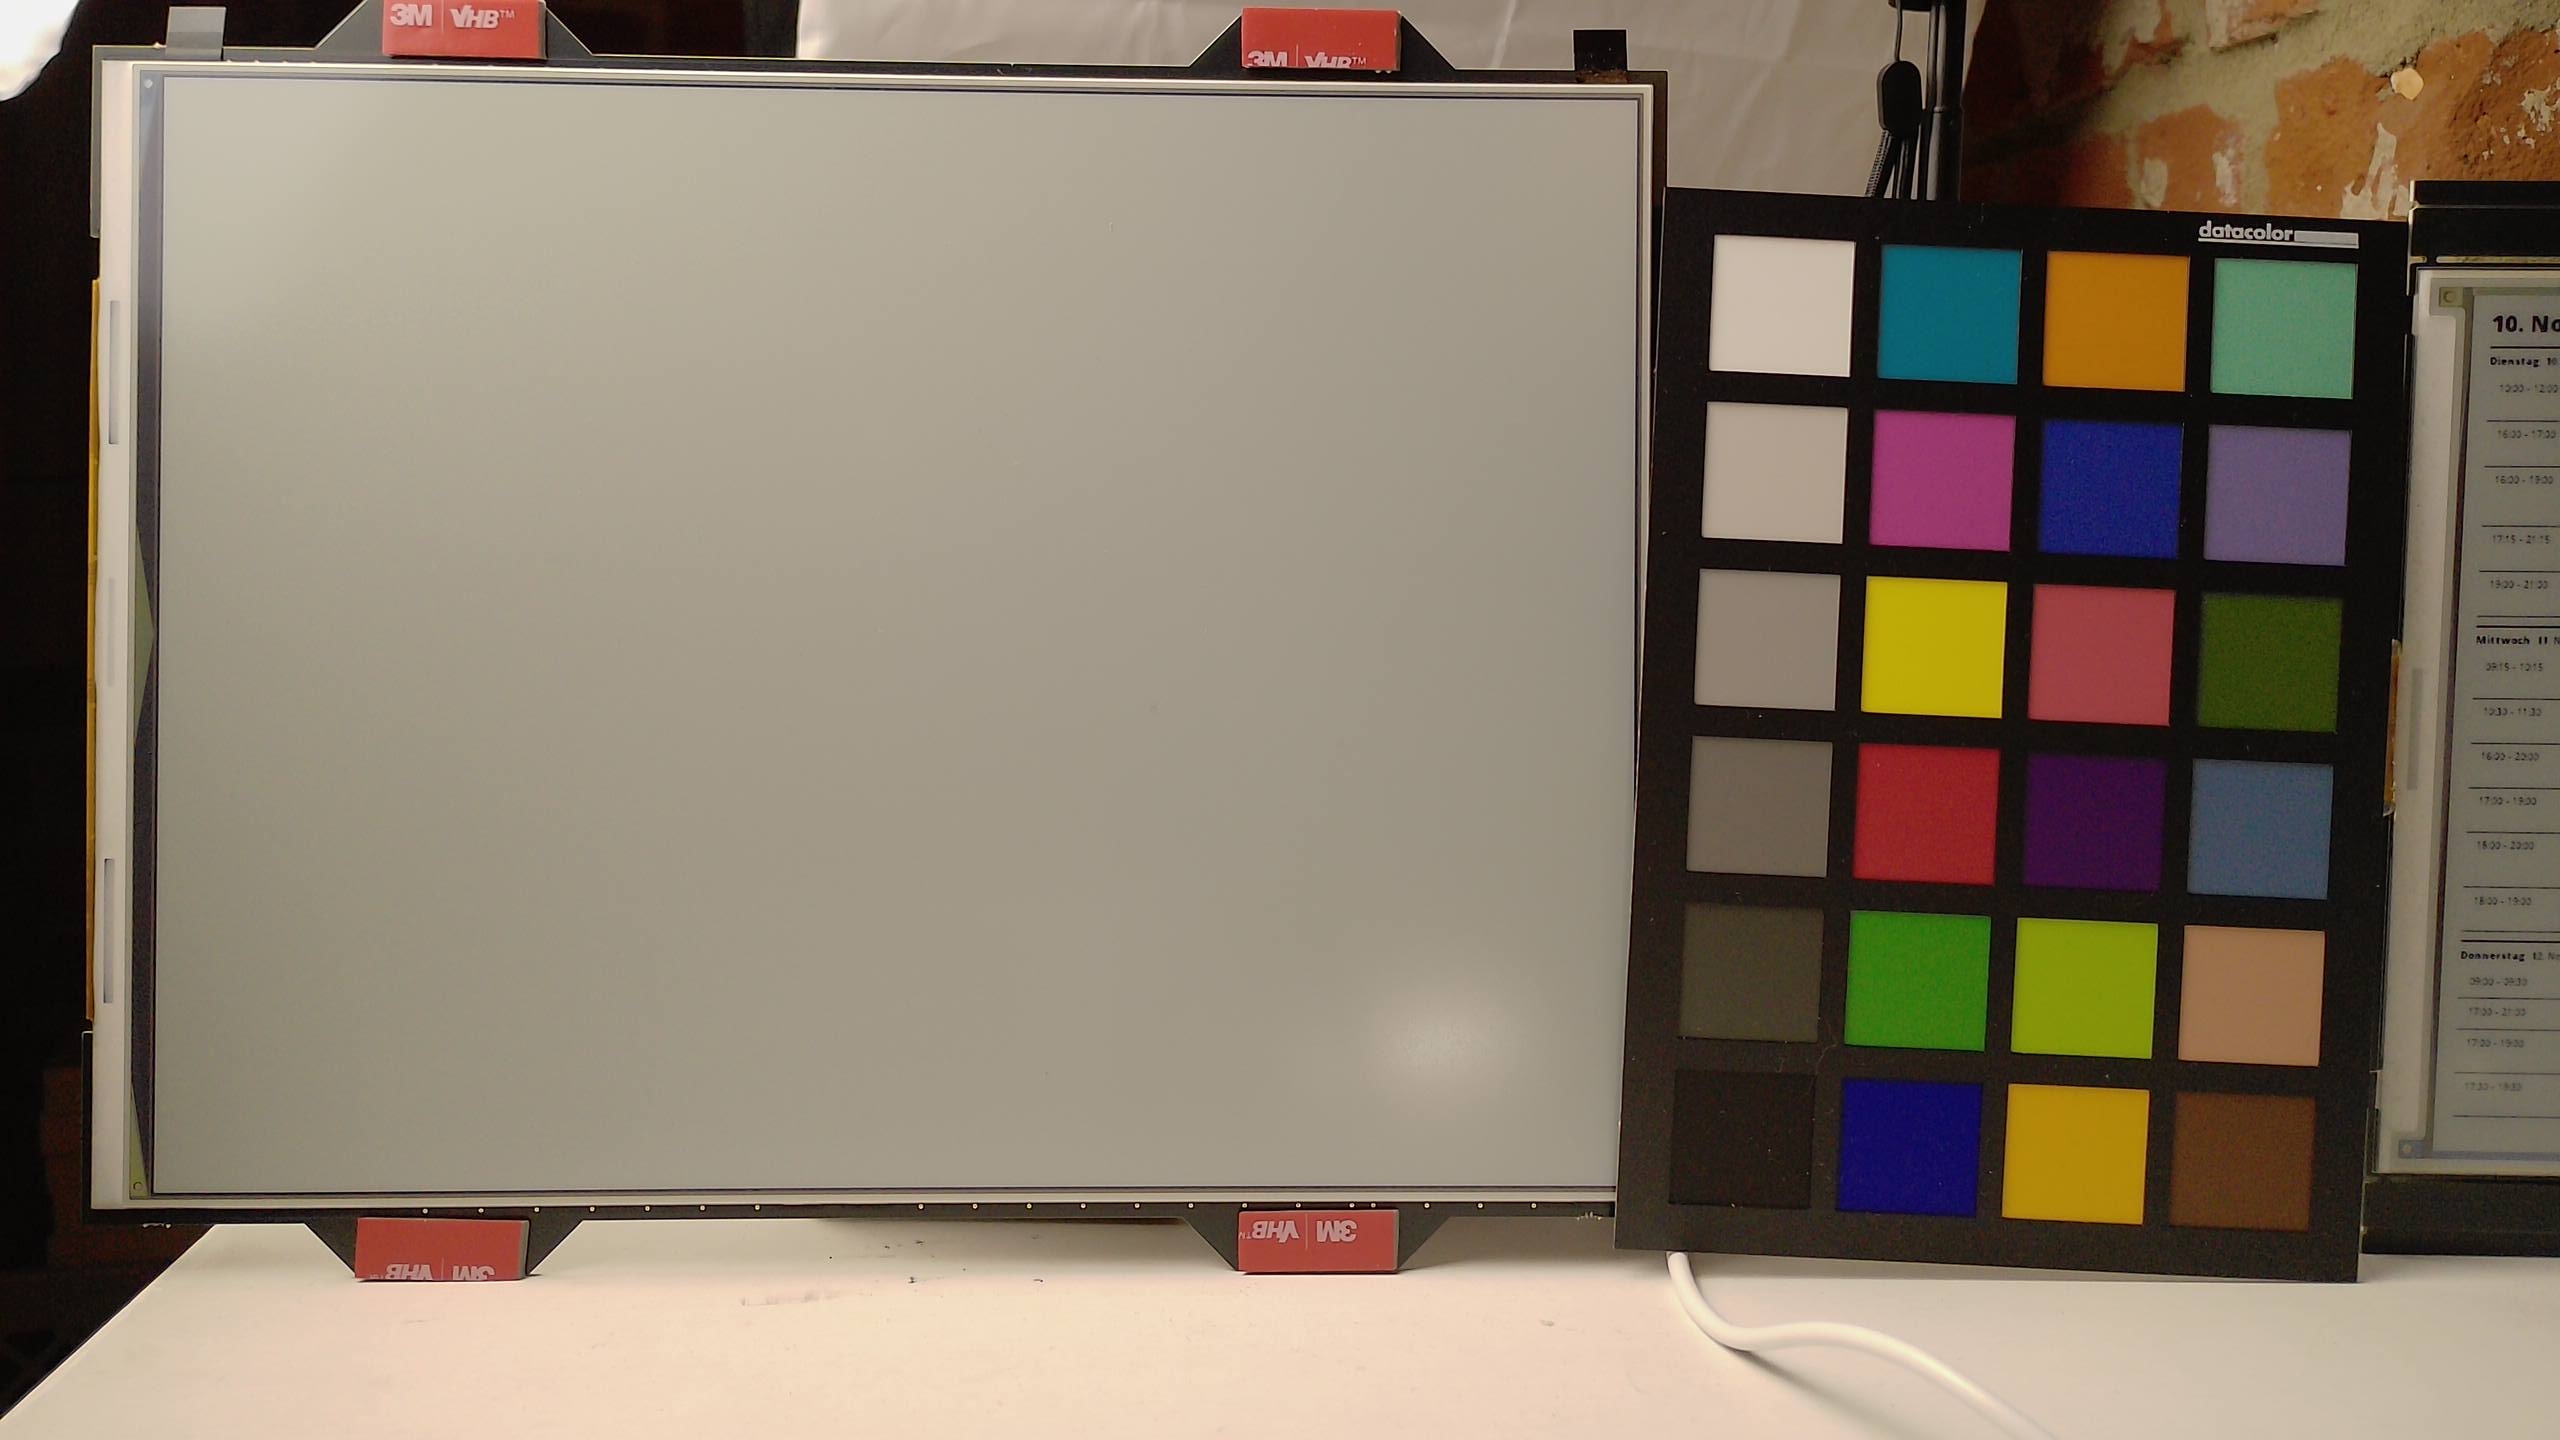
Capture settings
| Setting | Value |
|---|---|
| Test image | 1600 × 1200 pixels |
| Camera image | 2560 × 1440 JPEG |
| White-image spatial reference | Original 54-position grid, used for both layouts |
Exposure, lighting, frame selection, and profiling follow the shared measurement method.
Measurement notes
There is still a brightness gradient across the central fields. White and black vary more with position than some of the saturated colors. The reference-card cross-validation is about 4.5 ΔE₀₀ on average.
See the measurement limits before using these values for color matching or comparing panels.
Downloads
- Color measurements (JSON) — all 51 swatches, with Lab, XYZ, unclipped sRGB, input codes, and comparison metrics.
- Position comparison (JSON) — including excluded observations.
- Measurement table (CSV).
- Native test images: chart 1, chart 2, chart 3. Keep their original pixel dimensions and colors when repeating the test.