Overview
Panel color measurements, shared test setup, and how to read the results.
These measurements show how the panels reproduce their six native colors and dithered mixtures under the test lighting. A camera and a Spyder Checkr 24 reference card provide estimates of their appearance; the swatches display those estimates in sRGB.
| Panel | Test raster | Results |
|---|---|---|
| DKE 7 Inch · DEPG0730RTE730F0HP | 800 × 480 | Colors, captures, and downloads |
| DKE 13.3 inch · DEPG1330RTE133F5HP | 1600 × 1200 | Colors, captures, and downloads |
Setup
The panels sit beside the reference card, with cameras on small tripods in front of them. The 13.3-inch panel is on the left of the card; the 7-inch panel is on the right. These photos show the shared lighting and wiring with earlier test images. Each panel page includes the actual measurement captures.
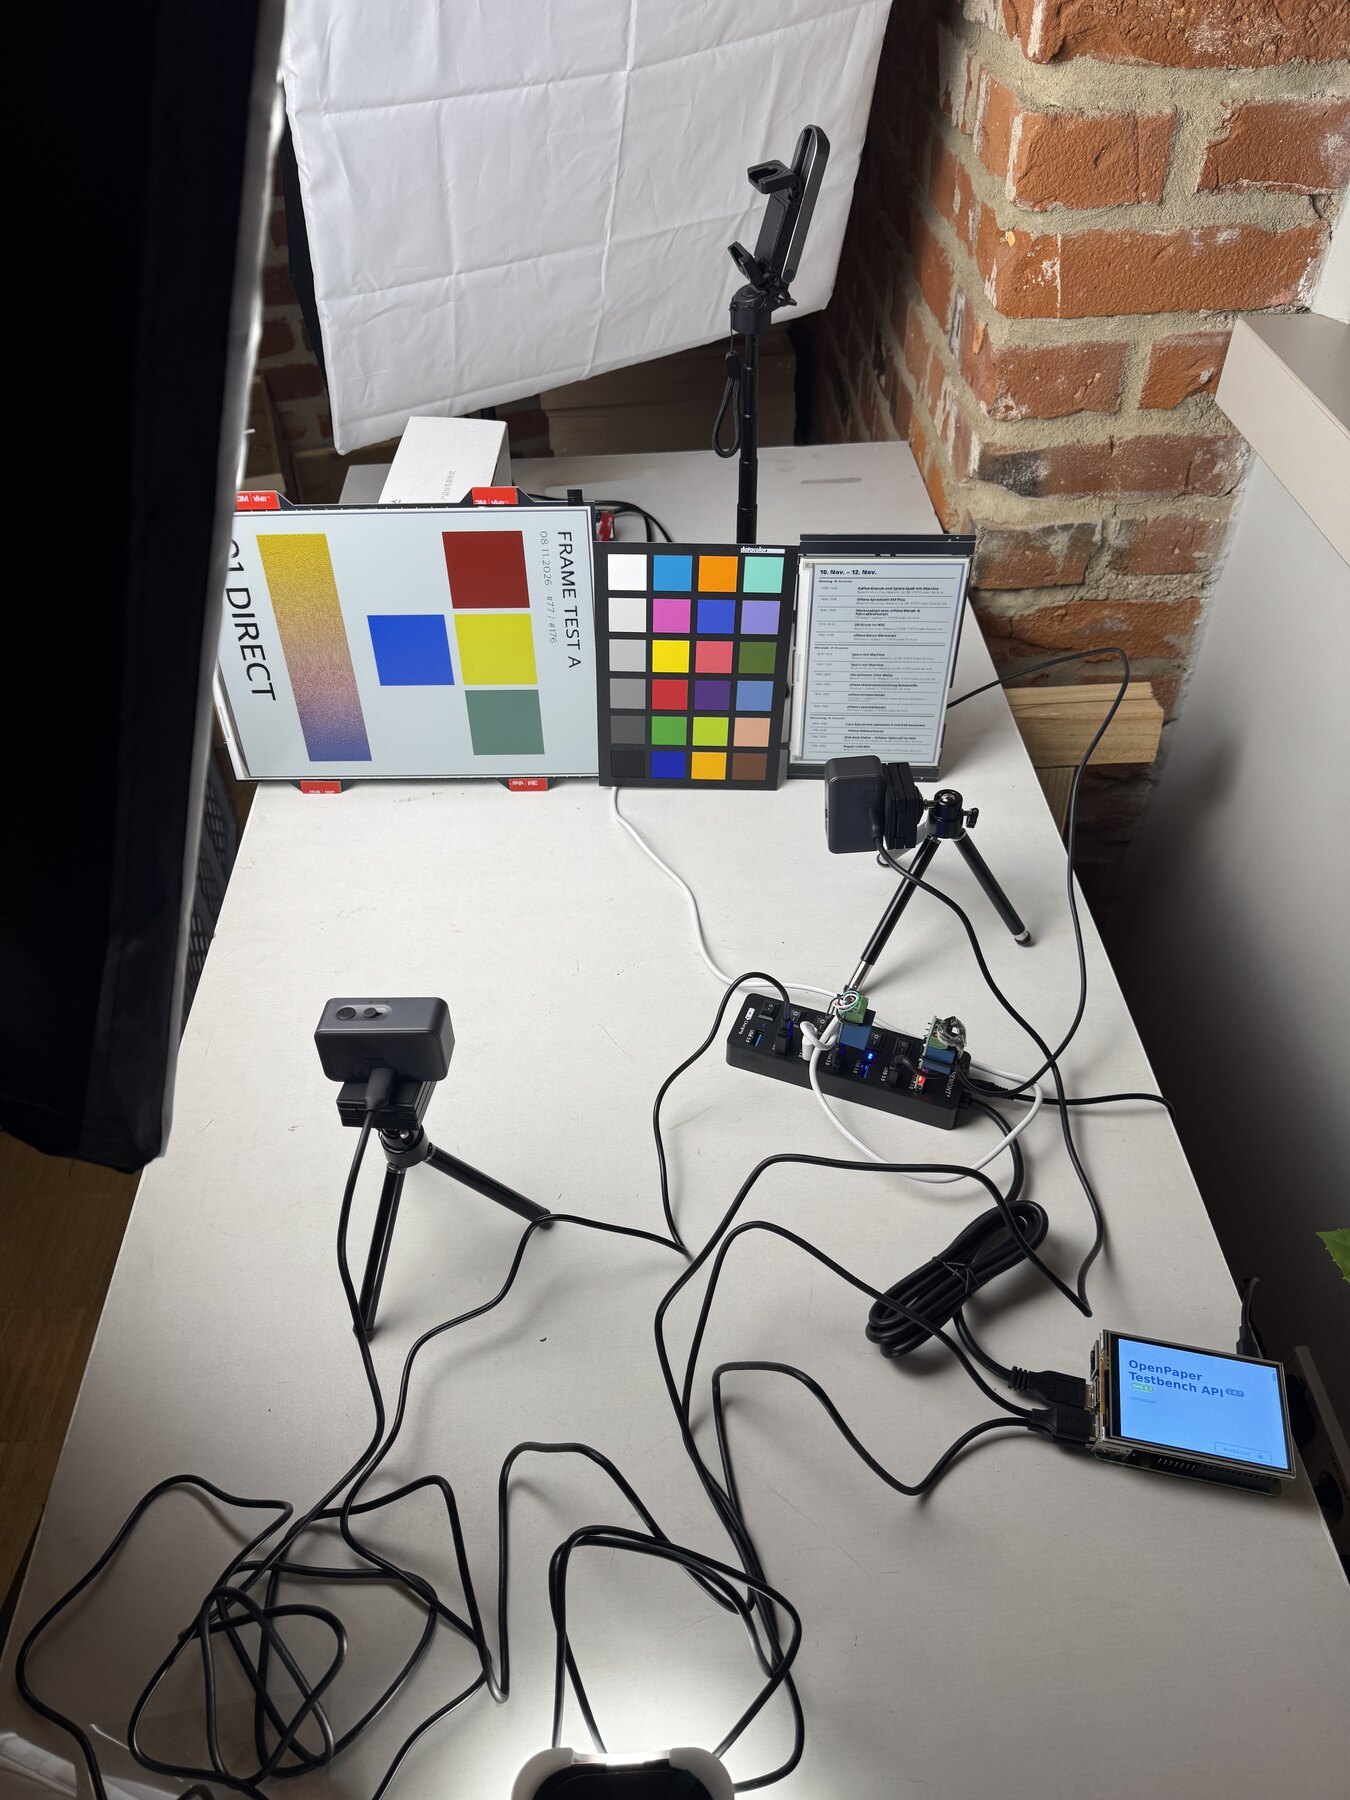
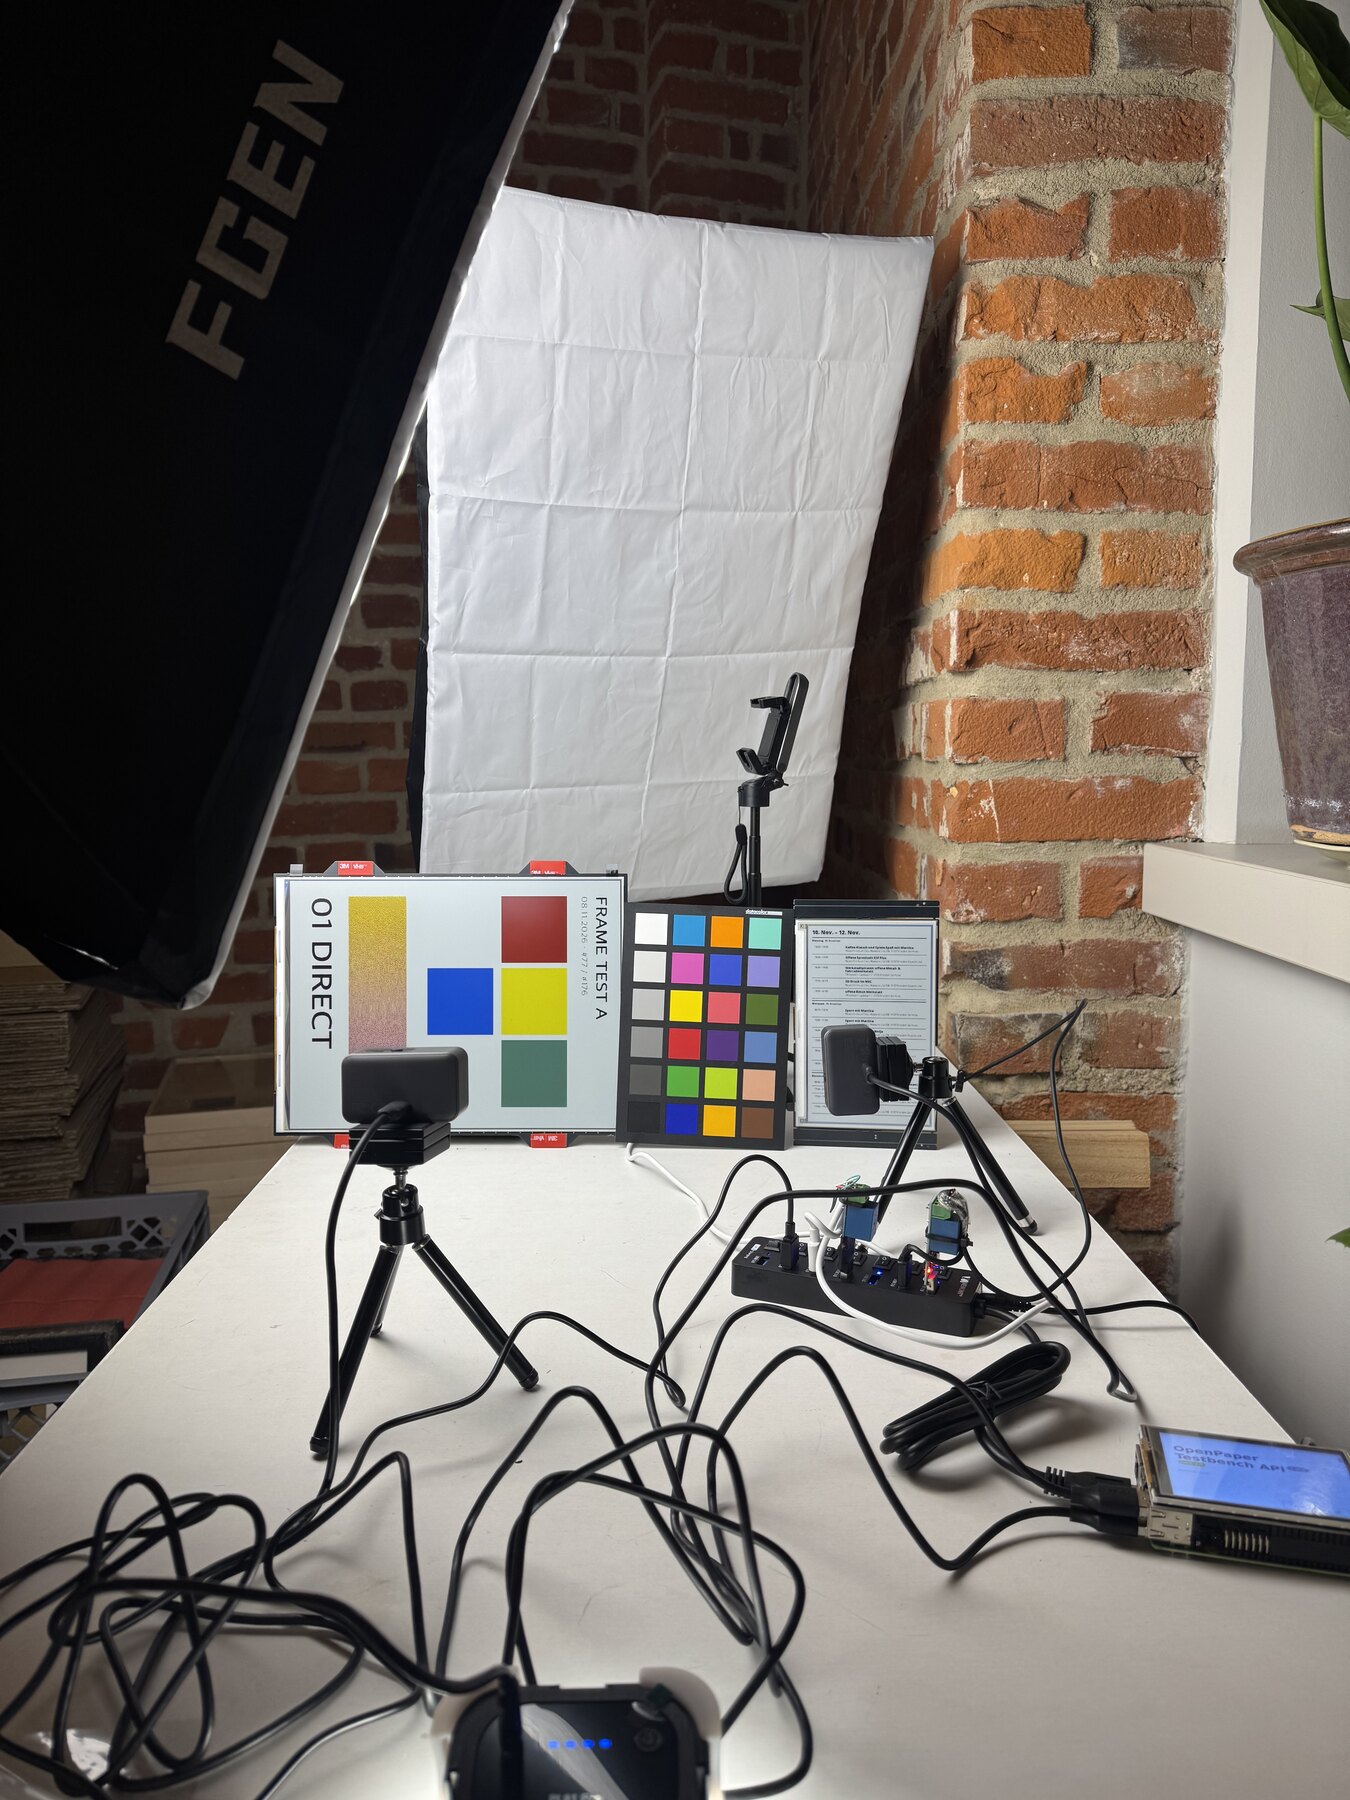
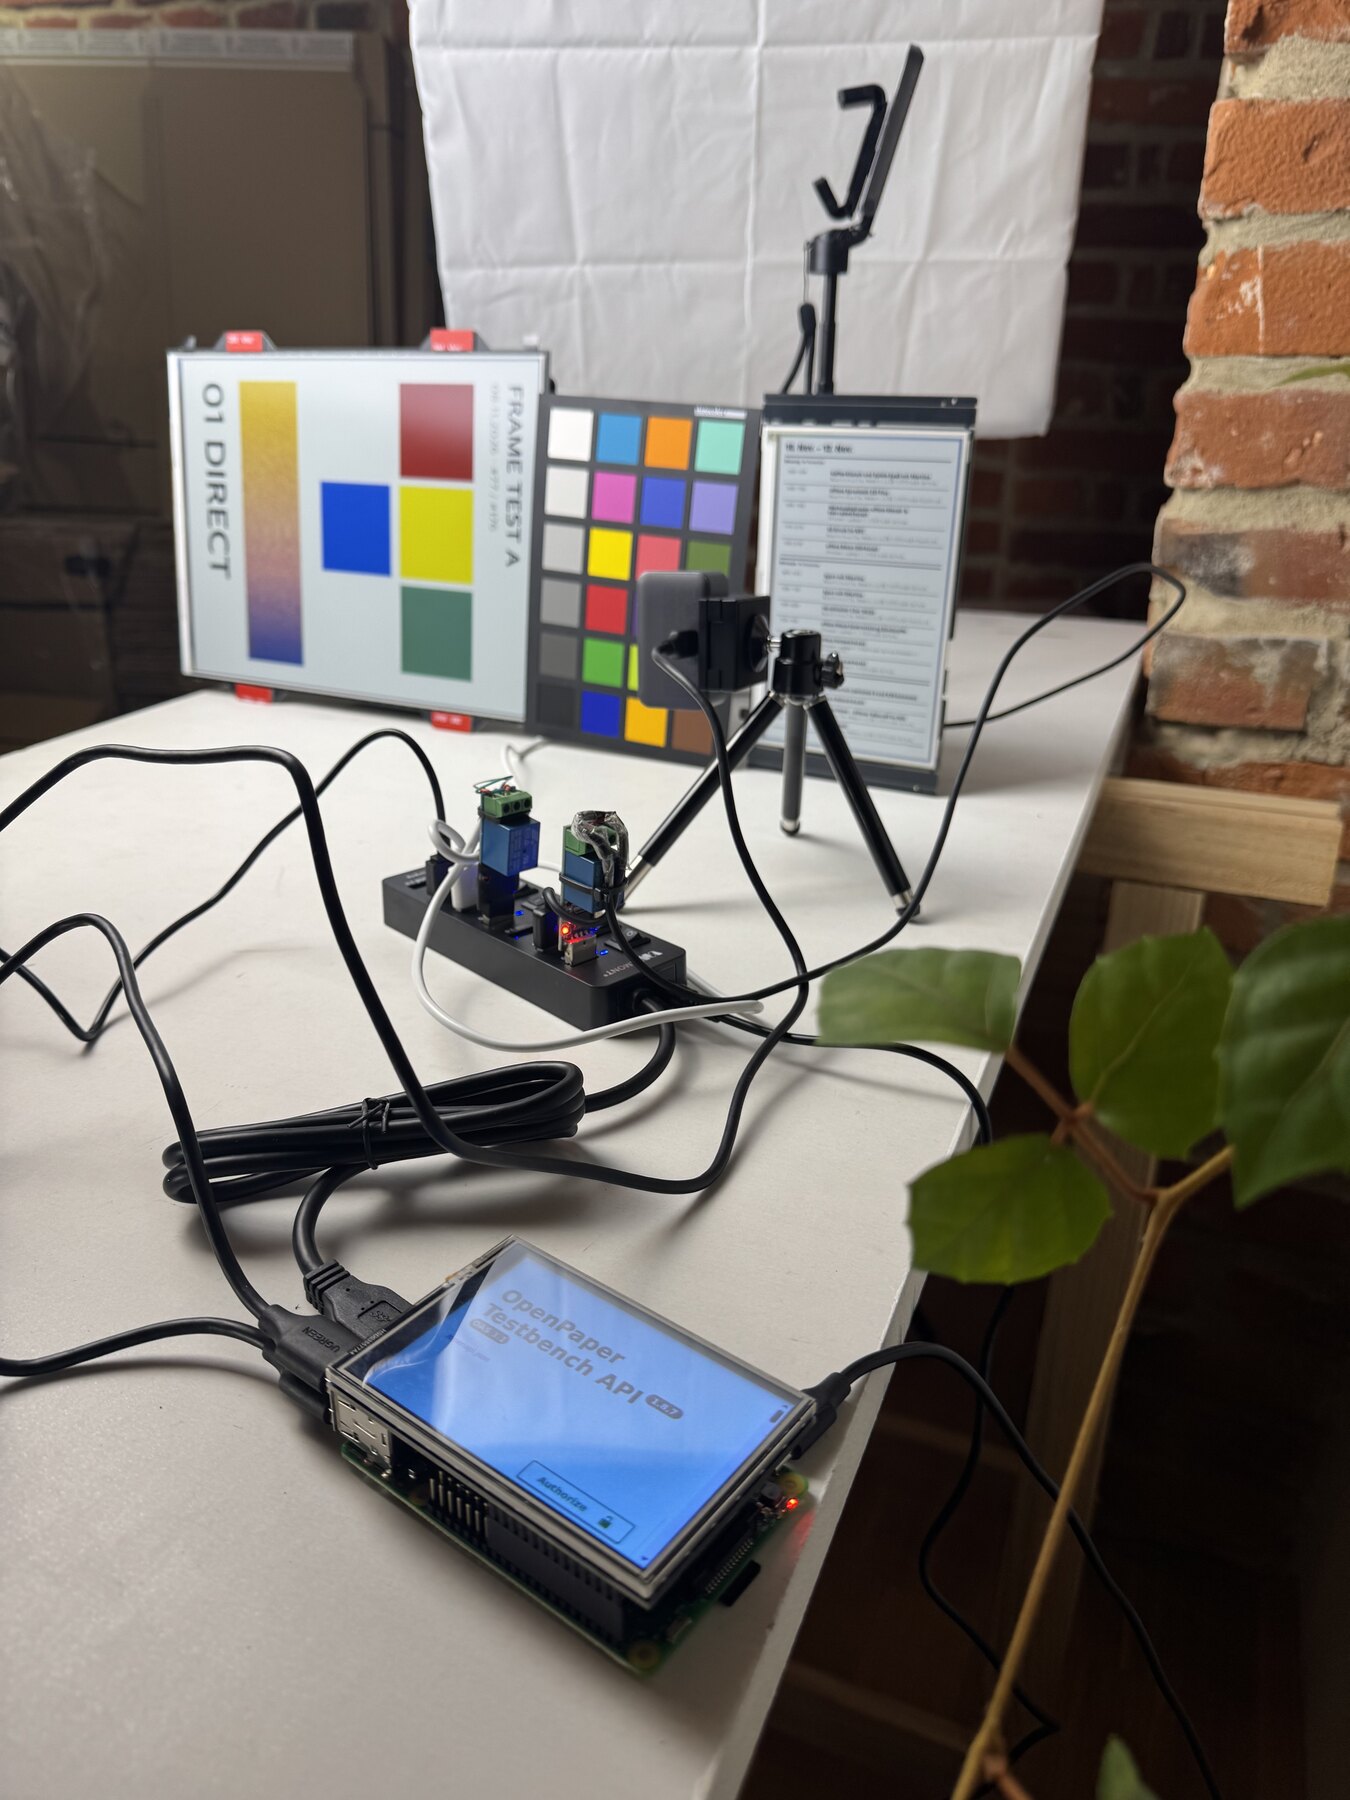
Test patterns
Each panel is tested with six solid colors and all 15 pairs of native colors at 25/75, 50/50, and 75/25 percent pixel coverage: 45 mixtures in total. A repeating 4 × 4 Bayer pattern assigns each pixel to one of the two colors, with exact pixel counts.
Three charts place each solid color at three different locations. Each mixture appears once. Moving the solid colors checks position dependence; a separate full-white image measures the brightness gradient. Field locations and exclusions are documented on each panel page.
Reading the swatches
- Input code is the RGB value sent to the panel. Measured sRGB is its estimated appearance under the test lighting. Your screen also affects how the swatch looks.
- Lab values are D65-equivalent estimates calculated from the card's nominal sRGB references. They do not establish that the lamp has a measured D65 spectrum.
- Max. position ΔE₀₀ is the largest difference between a solid color's three positions after white-image correction. Smaller values mean better agreement across positions, not greater absolute accuracy.
- Area-model ΔE₀₀ compares a measured mixture with the pixel-coverage-weighted average of its two measured solid colors in XYZ. Lighting, camera response, field position, and the dither pattern all contribute to the difference.
Measurement method
| Shared setting | Value |
|---|---|
| Exposure | Manual, 3.9 ms |
| White balance | Manual, nominal 6500 K |
| Focus | Manual |
| Lamp | 100% brightness, nominal 6500 K; spectrum not measured |
| Frames per chart | Two startup frames discarded, then three frames measured |
| Reference | Spyder Checkr 24, nominal Datacolor sRGB values |
The panel pages list their image dimensions, camera-processing details where recorded, and spatial reference grids.
Uploaded images are downloaded again and checked for exact pixel equality. Capture starts after the panel finishes refreshing. The first two camera frames are discarded to avoid the stream's startup brightness transient.
JPEG values are linearized with an assumed sRGB transfer function before averaging. All 24 reference patches are used to fit an affine RGB-to-XYZ model with 12 parameters, optimized in CIELAB. Cross-validation leaves out one reference patch at a time; it checks the fit to the card, not accuracy on the panel's pigments.
A projective mapping locates the fields in the camera image. Only the central 60% of each field's width and height is sampled, avoiding labels and edges. A scalar correction from the white image compensates for uneven brightness. The spatial reference grid differs between the panels and is recorded on each page. Solid-color results average three positions.
Measurement limits
Nominal card values, JPEG processing, the unmeasured lamp spectrum, and differences in the camera's response to card inks and e-paper pigments limit absolute accuracy. A good fit to the card does not guarantee an equally accurate measurement of the panel.
The white-image correction reduces brightness gradients but cannot remove reflected glare. Moving the fields reveals spatial variation, although these tests do not separate position from refresh history. Each mixture was measured at one position, and the results apply to the tested Bayer pattern.
The panels were measured with different cameras and geometries. Small differences between their palettes should not be read as a precise hardware comparison.
Absolute color measurements require a reflection spectrophotometer and defined lighting and viewing geometry. A production lookup table also needs separate validation fields and testing with the intended dithering method.