DKE 7 Inch (DEPG0730RTE730F0HP)
Solid colors, dithered mixtures, and measurement setup for the DKE 7-inch panel.
The DEPG0730RTE730F0HP uses six native colors at 800 × 480 pixels. DKE lists it as a 7.3-inch panel; it is used here in the OpenPaper 7.
The measurements cover six solid colors and 45 dithered mixtures. These are camera-based estimates under the test lighting; see the Panels overview for the shared setup, method, and how to read the swatches.
Setup
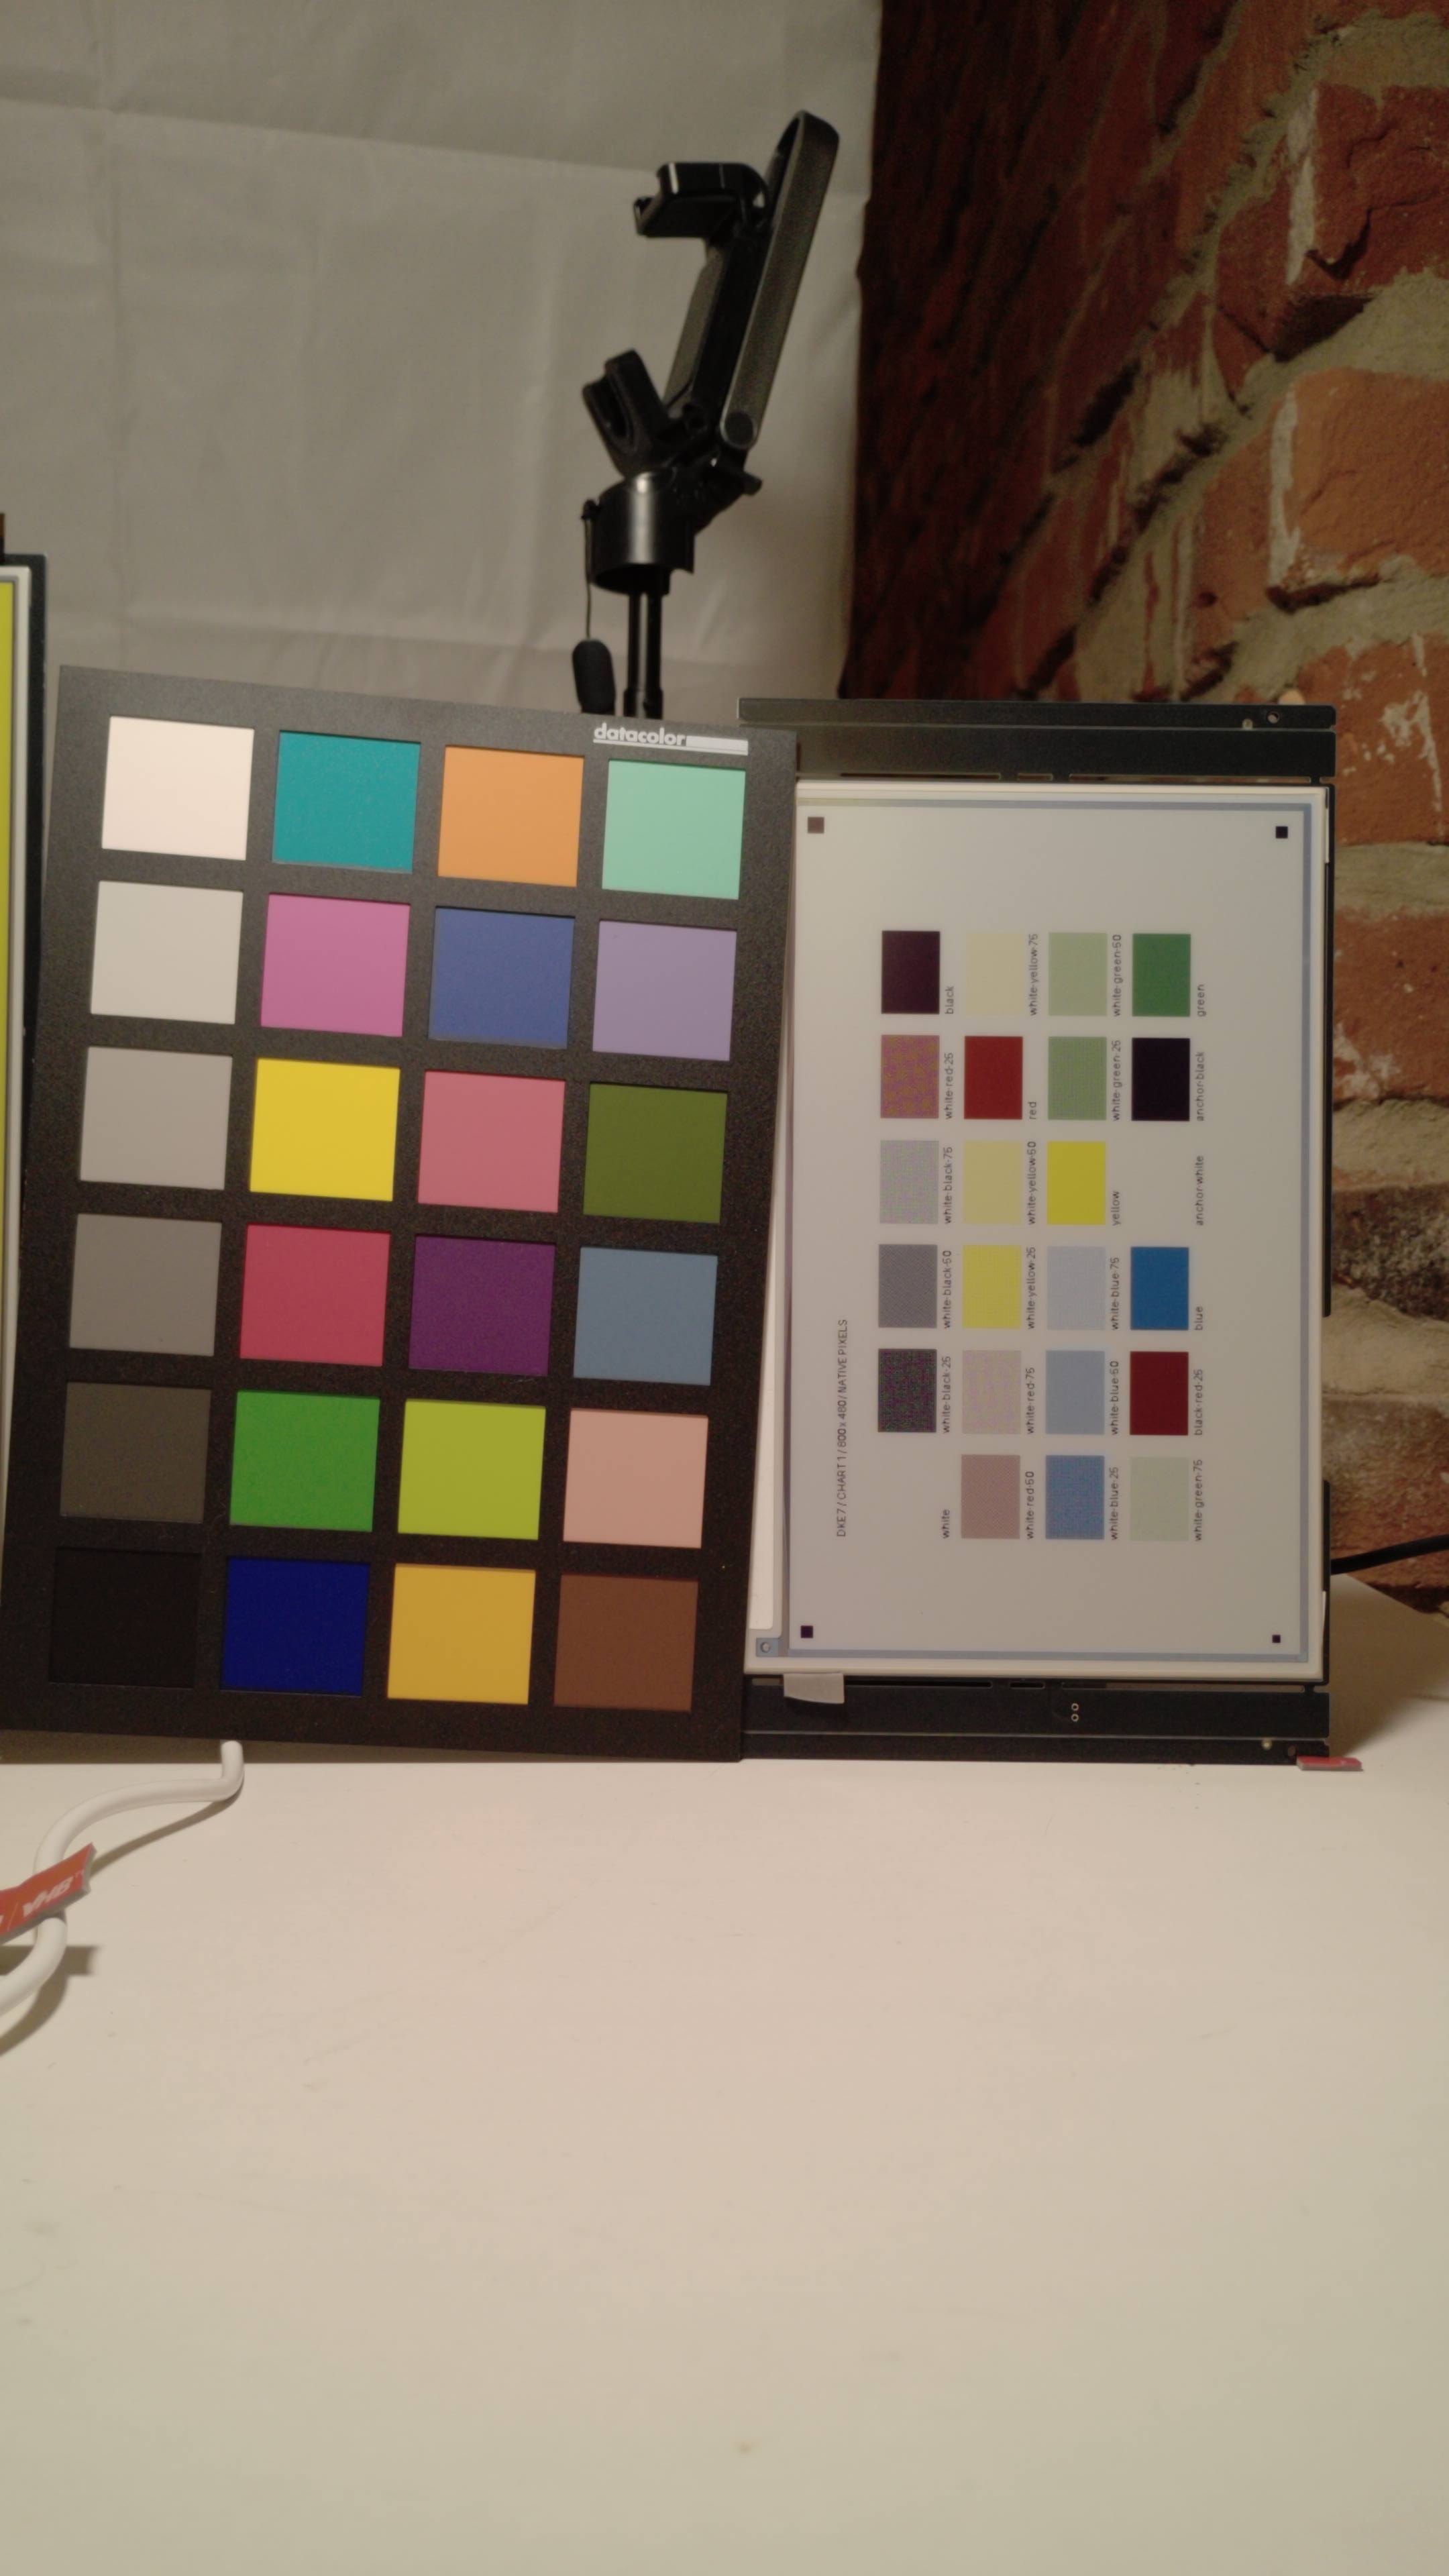
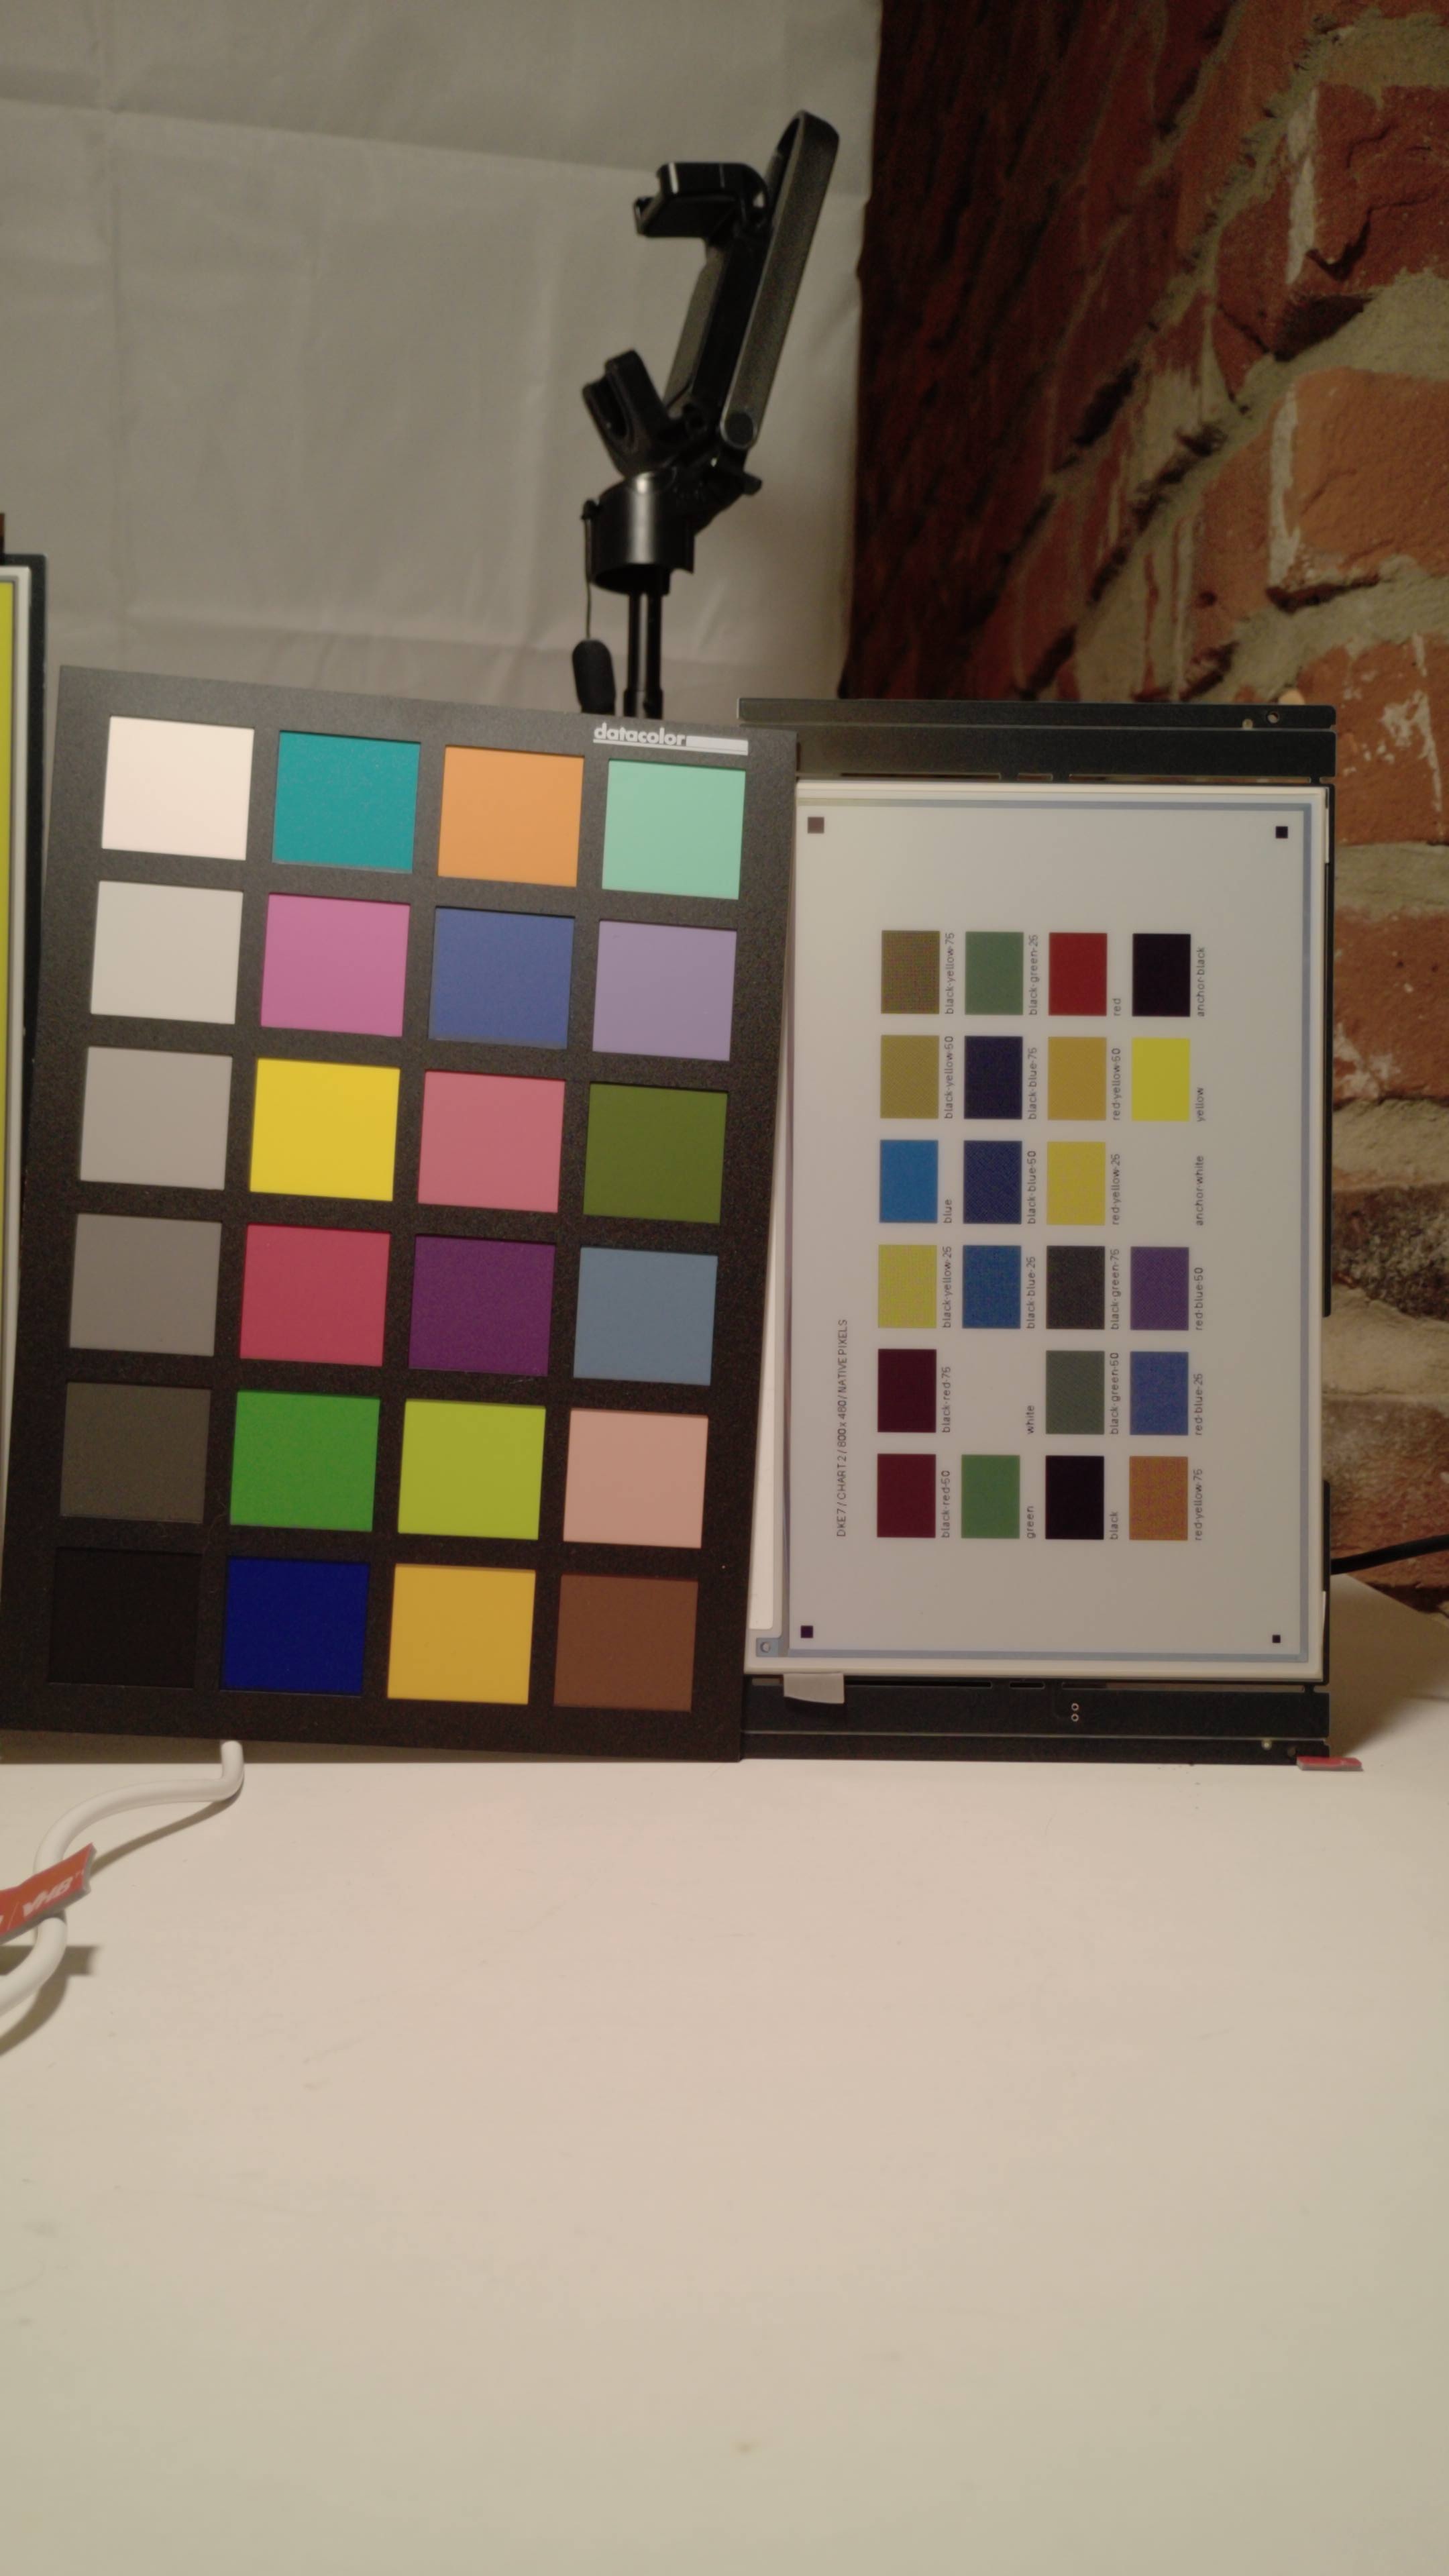
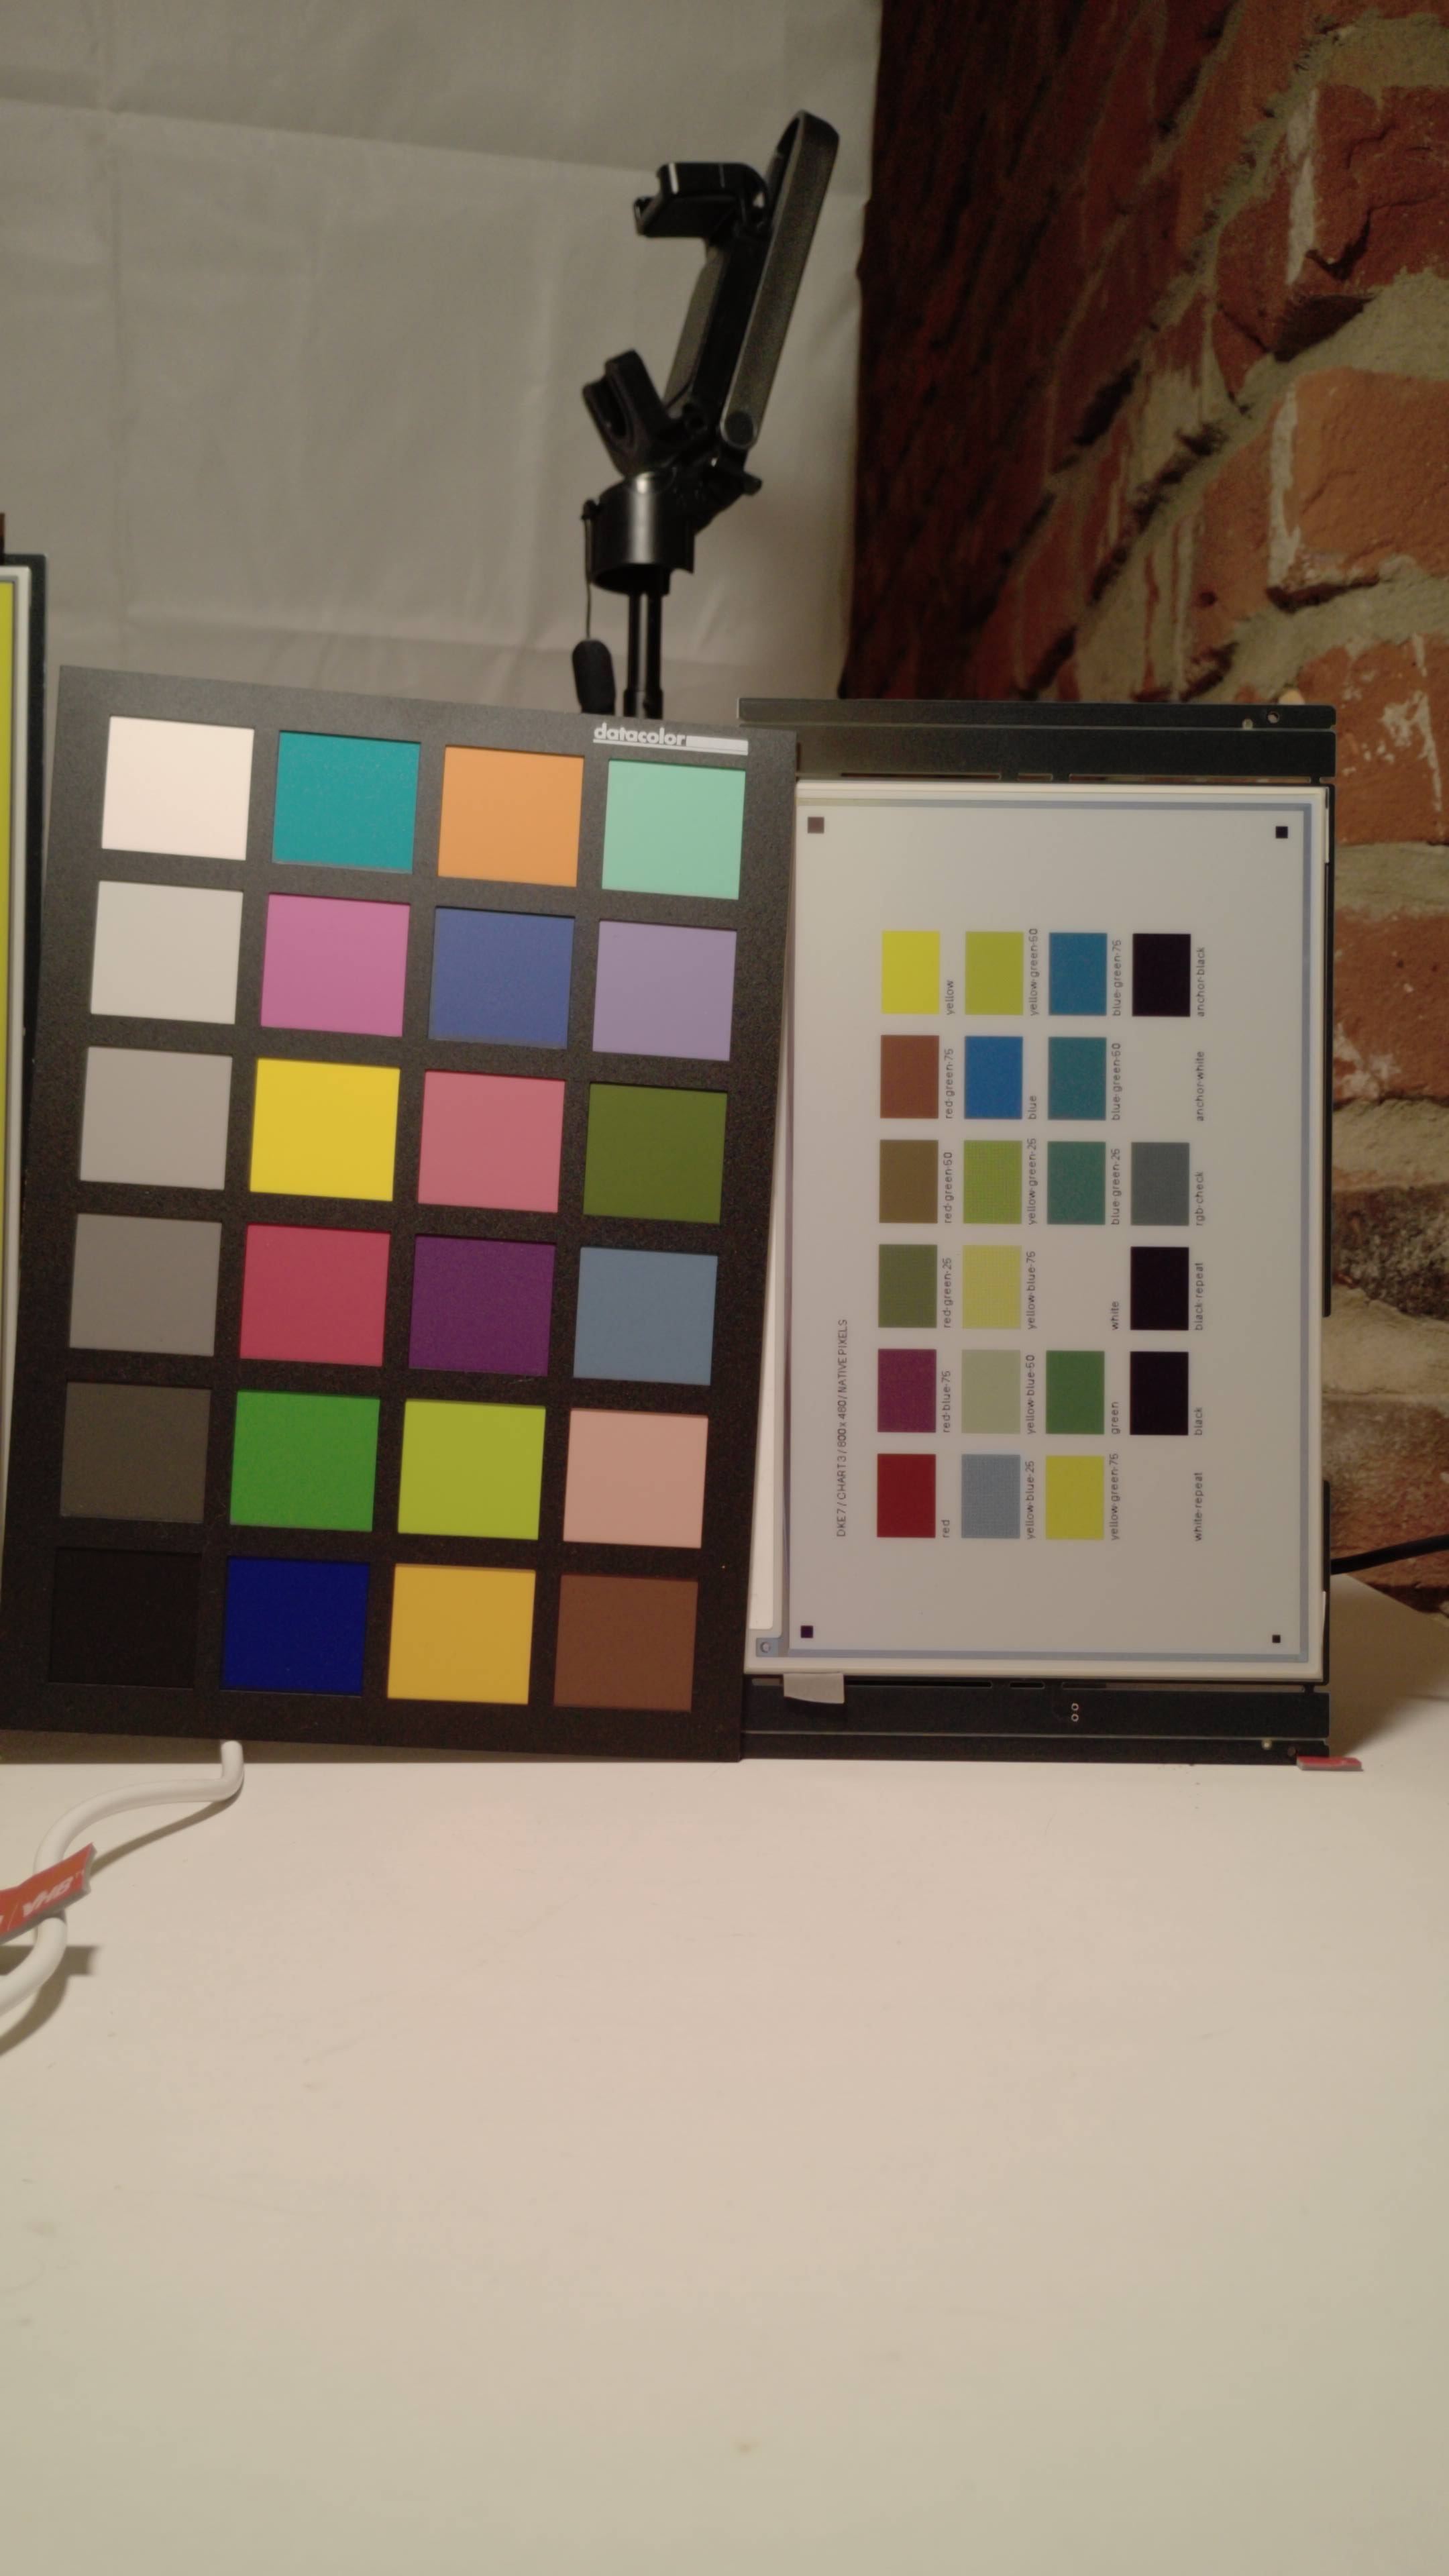
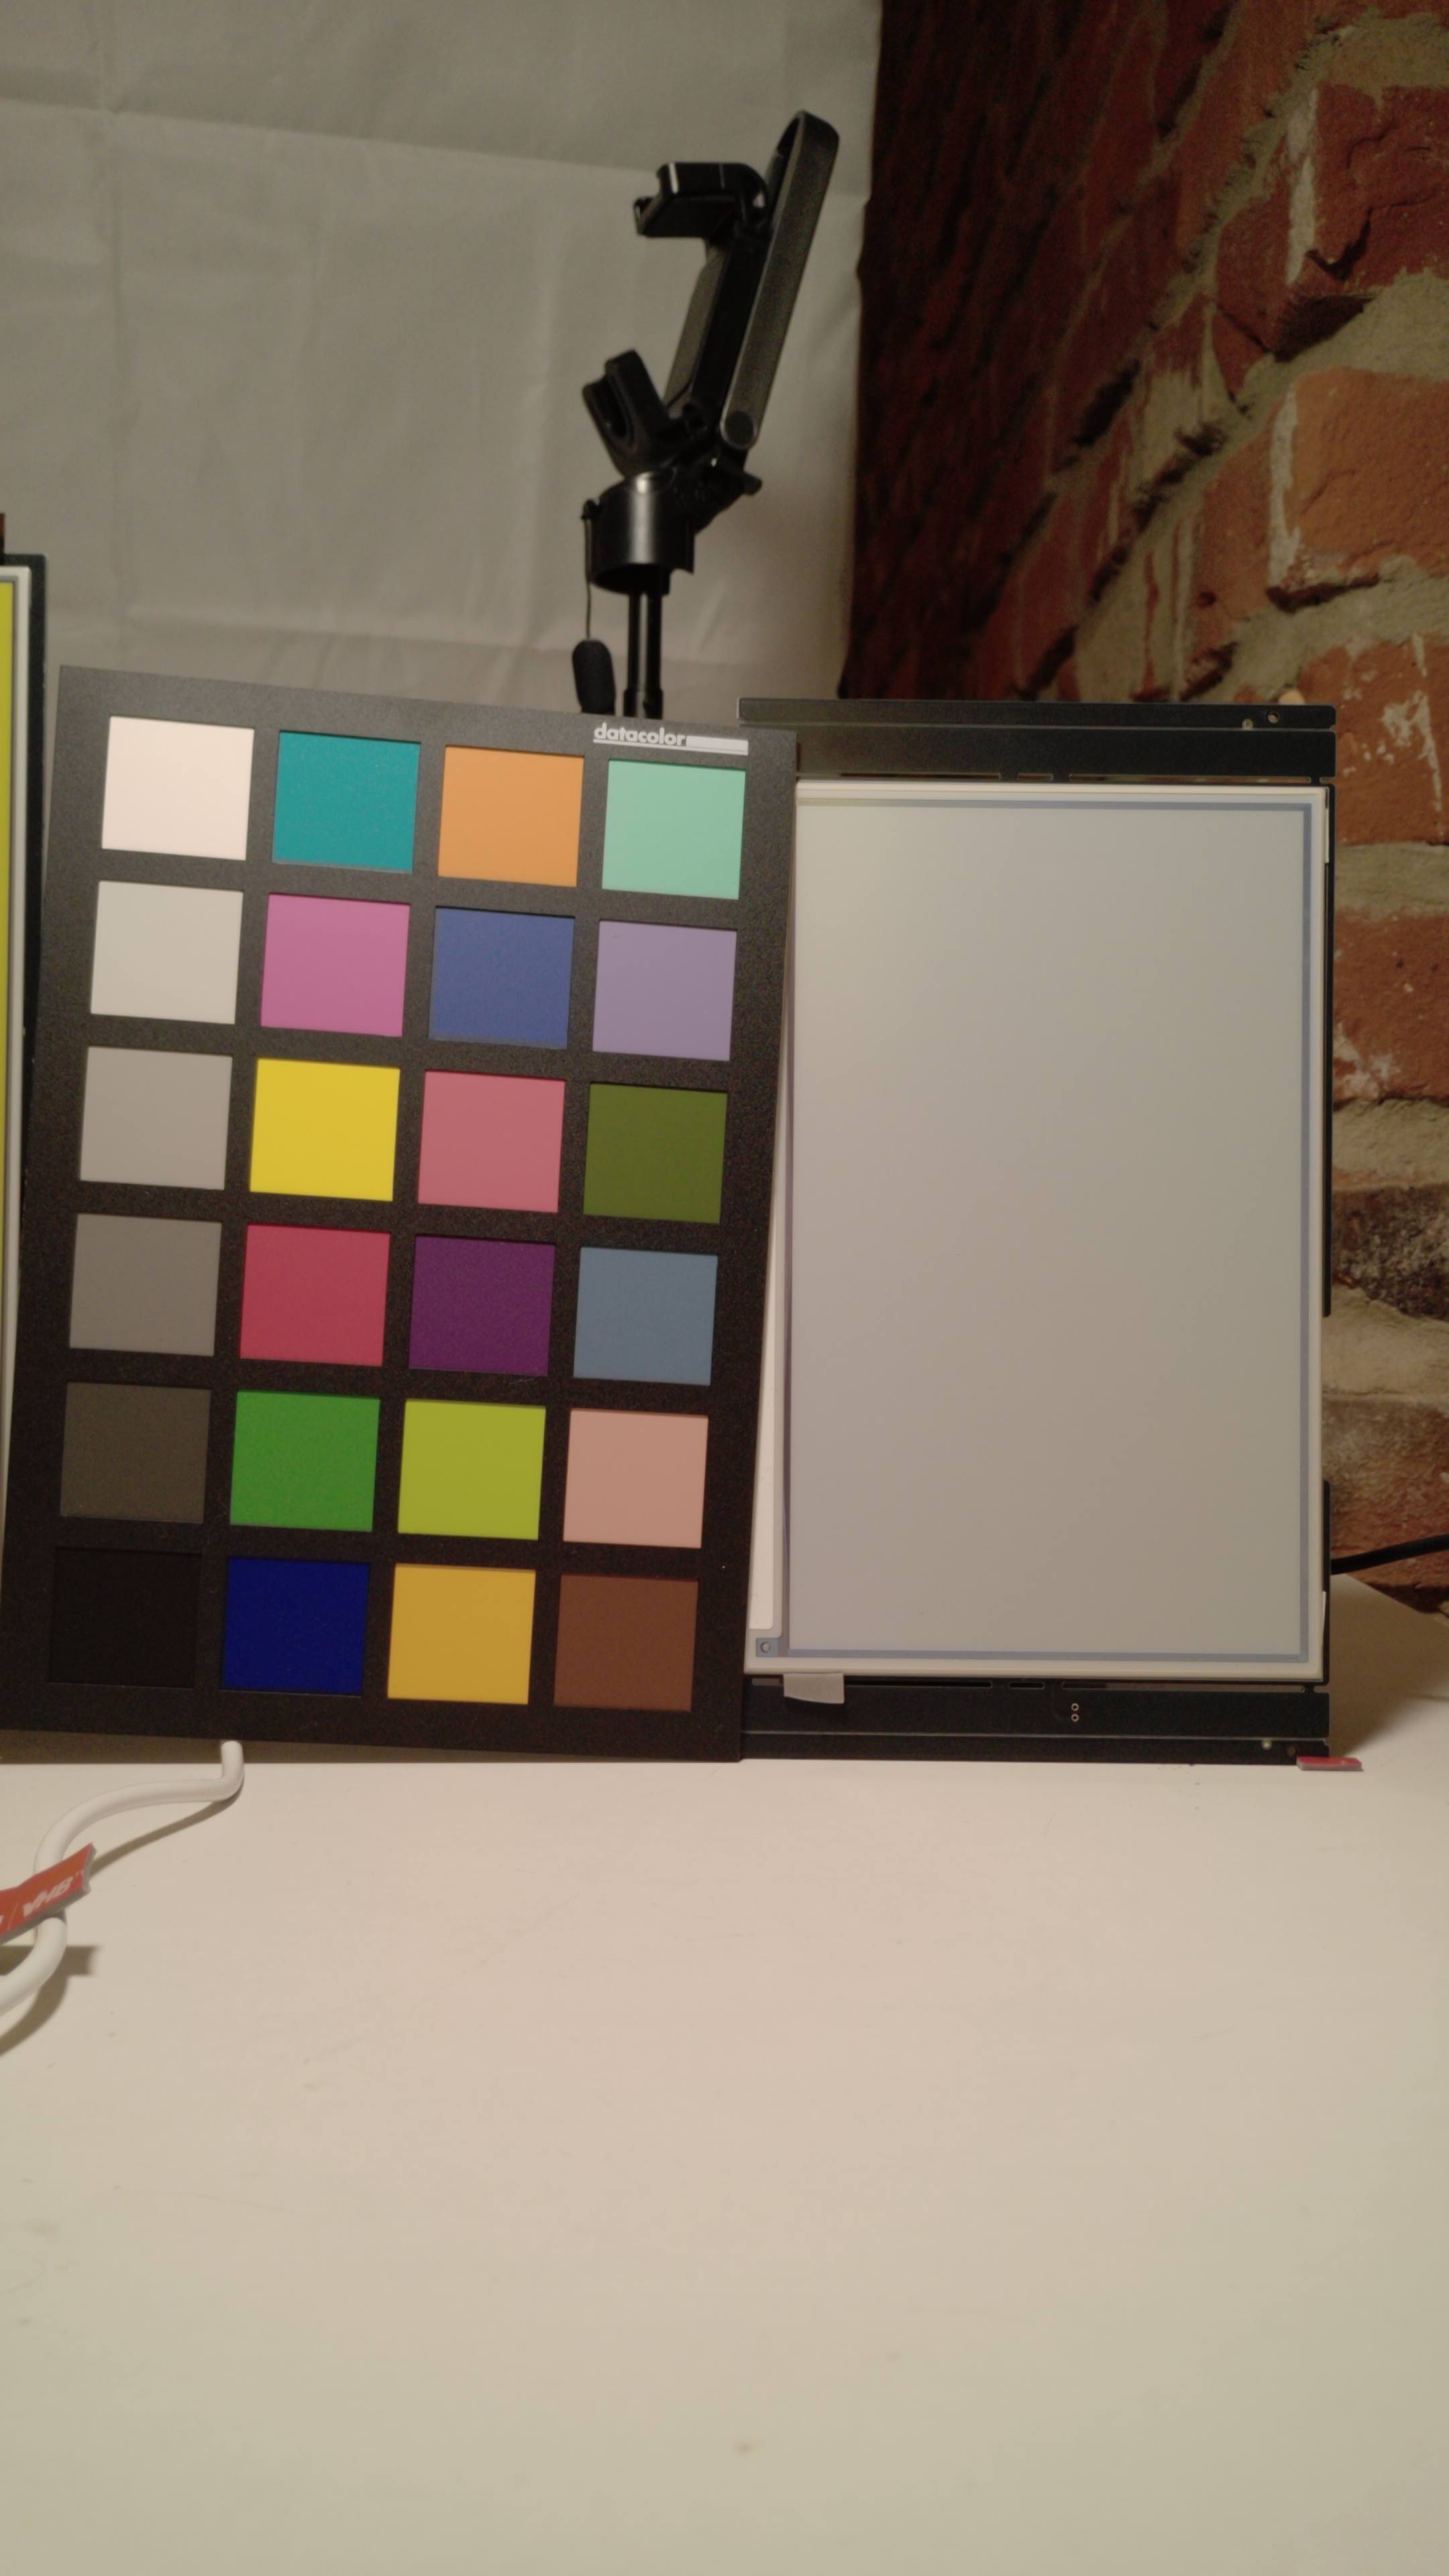
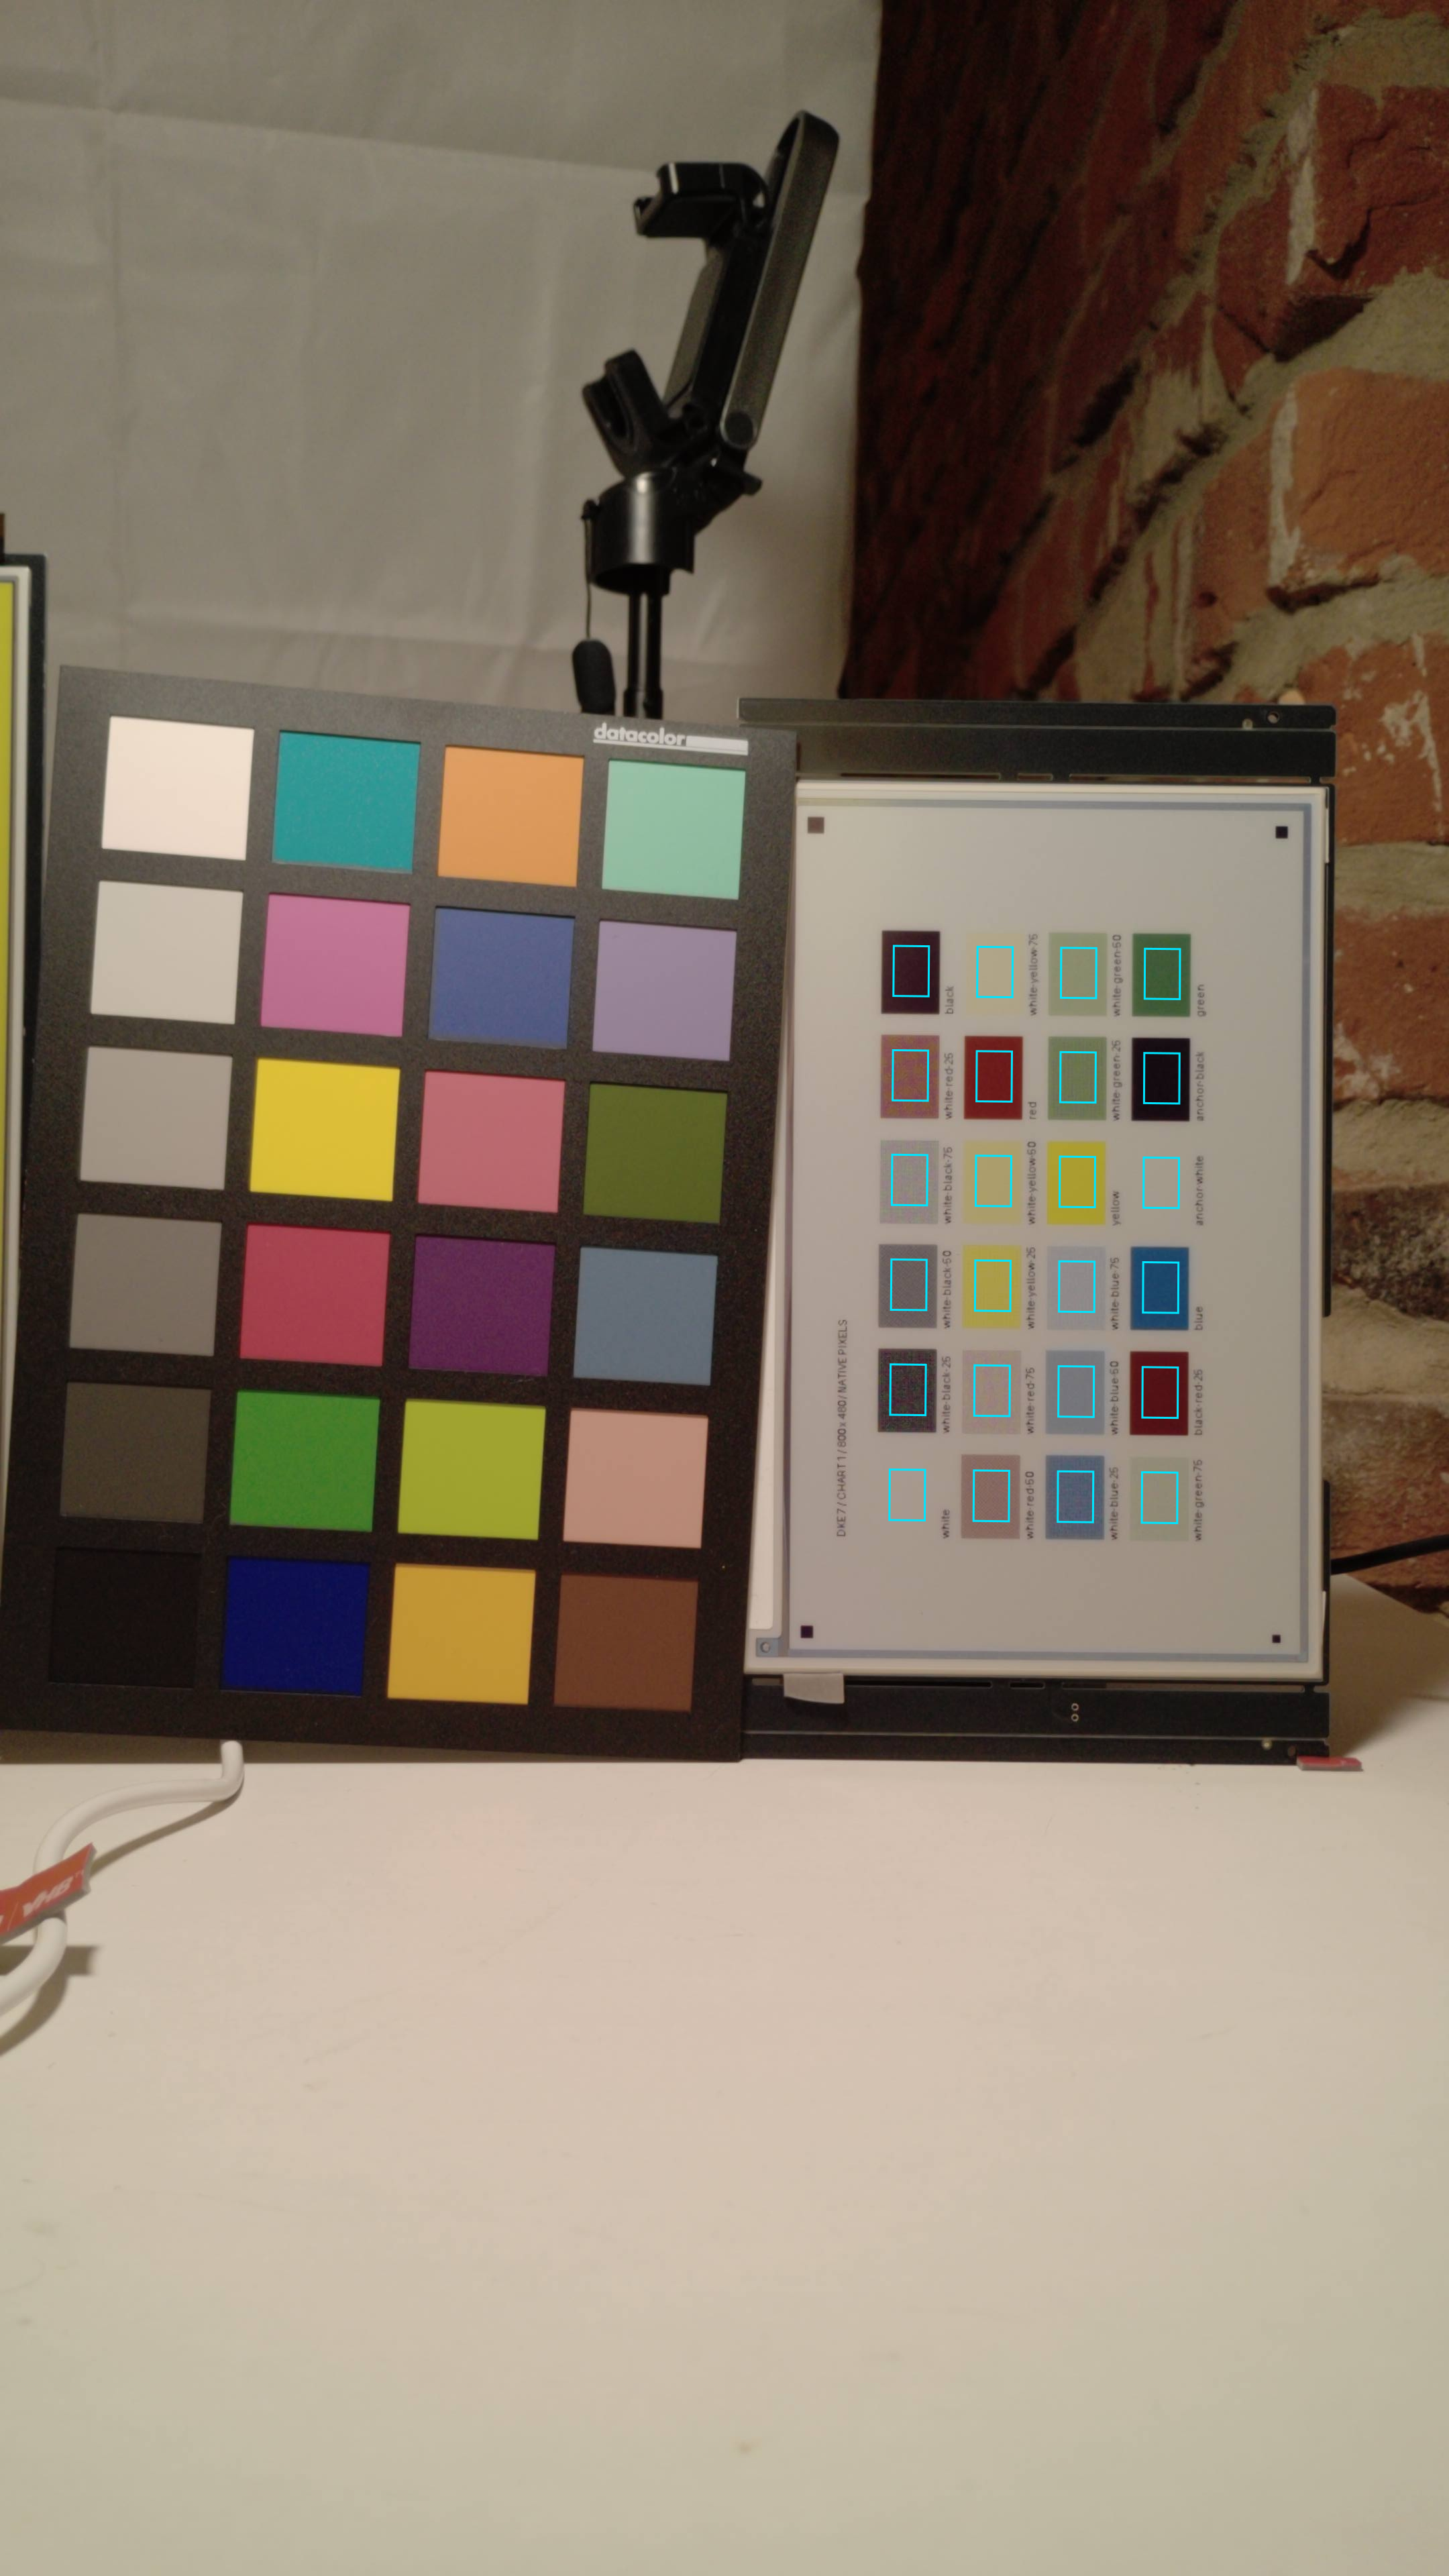
The 7-inch panel stands to the right of the reference card on the shared bench. The card overlaps part of the panel's left edge, so the test fields sit inside the visible central area.
Solid colors
Each solid color was measured at three positions. The swatches show the average after white-image correction.
#A89CA0- sRGB
- 168, 156, 160
- Lab
- 65.5 / 4.9 / -0.5
- Input code
- #FFFFFF
- Max. position ΔE₀₀
- 1.71
#313740- sRGB
- 49, 55, 64
- Lab
- 22.9 / -0.1 / -6.2
- Input code
- #000000
- Max. position ΔE₀₀
- 14.51
#762524- sRGB
- 118, 37, 36
- Lab
- 27.4 / 35.3 / 20.4
- Input code
- #FF0000
- Max. position ΔE₀₀
- 2.08
#B5AD2E- sRGB
- 181, 173, 46
- Lab
- 69.5 / -11.7 / 61.8
- Input code
- #FFFF00
- Max. position ΔE₀₀
- 1.30
#00508A- sRGB
- 0, 80, 138
- Lab
- 32.4 / -1.5 / -39.1
- Input code
- #0000FF
- Max. position ΔE₀₀
- 1.00
#476A56- sRGB
- 71, 106, 86
- Lab
- 41.8 / -17.5 / 7.6
- Input code
- #00FF00
- Max. position ΔE₀₀
- 2.93
Field positions
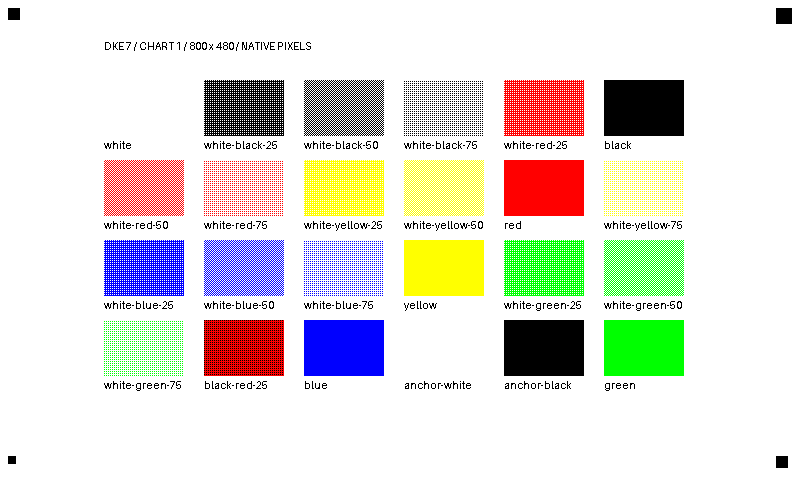
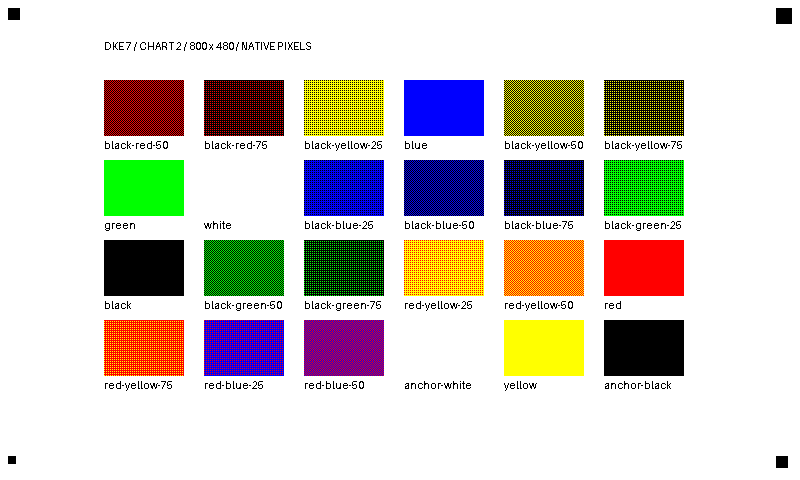
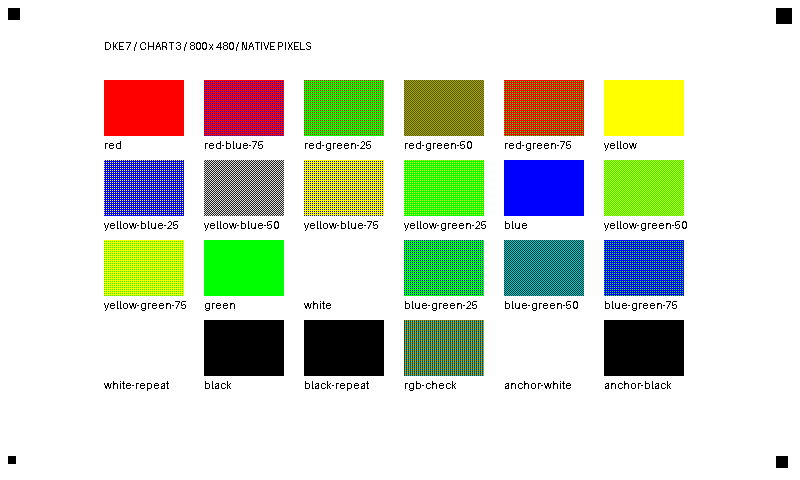
Three charts place the same six solid colors at different locations. Each chart has 24 fields in the central area, within x = 104–684 and y = 80–376 in the native 800 × 480 raster. The surrounding margin keeps the sampled fields away from the card overlap and panel edges.
| Check | Result |
|---|---|
| Mean solid-color position difference | 2.71 ΔE₀₀ |
| Largest solid-color position difference | 14.51 ΔE₀₀ |
| Brightest / darkest sampled location in the white image | 1.37× |
| Reference-card cross-validation, mean across charts | 6.31 ΔE₀₀ |
| Largest held-out reference-card error | 16.87 ΔE₀₀ |
| Largest fraction of field pixels at a camera channel limit | 0.00% |
| Largest frame-to-frame field difference | 0.43 ΔE₀₀ |
An initial pass clipped dark channels in several dithered fields. We repeated the full series with camera saturation reduced from 128 to 96 and sharpening set to zero. The values on this page come from that second series.
The largest difference belongs to black. Its three positions differ by up to 14.51 ΔE₀₀, so treat that swatch as an average with noticeable position dependence.
The position differences include residual lighting and camera effects. This test does not separate field position from refresh history. The white-image correction compensates for a brightness gradient, but cannot remove reflected glare. No measurements from the 13.3-inch panel are used to calculate these values.
Mixtures
The 45 mixtures use the shared Bayer patterns. The mean area-model difference is 4.23 ΔE₀₀.
#4A4550#68636E#8A848D#84504F#8F6E70#9C898C#B6AA4E#AEA475#A7A090#4D668D#747D96#8D8EA1#6D7F68#85907D#999891#652F34#54313A#43333D#9F9042#827040#625441#184673#293A5C#2B3749#4C6256#4B5554#3A4048#AC9735#9E8030#8A5534#304775#4A3D62#682E45#5E634C#6B5940#734535#646F80#8C8C77#A49D59#79854C#979B3D#ACA339#386466#1B5F73#005980Camera captures
These are the original 2160 × 3840 JPEGs, without additional color correction or image optimization. Open a photo to inspect the fields at full size. The panel is mounted vertically; the test images retain their native 800 × 480 pixel dimensions.
Capture settings
| Setting | Value |
|---|---|
| Test image | 800 × 480 pixels |
| Camera image | 2160 × 3840 JPEG |
| Camera processing | Saturation 96/255; sharpness 0/255 |
| White-image spatial reference | The same 24 locations across all three charts |
Exposure, lighting, frame selection, and profiling follow the shared measurement method.
Measurement notes
The reference-card cross-validation is about 6.31 ΔE₀₀ on average, with a largest held-out error of 16.87 ΔE₀₀. Black varies substantially across positions, as shown above. Each mixture was measured at one position, so the solid-color checks do not establish repeatability for every mixture.
See the measurement limits before using these values for color matching or comparing panels.
Downloads
- Color measurements (JSON) — all 51 swatches, Lab, XYZ, unclipped sRGB, and comparison metrics.
- Individual observations (JSON) — including sampling polygons and per-frame checks.
- Camera profiles and sampling coordinates (JSON).
- Measurement table (CSV).
- Native images: chart 1, chart 2, chart 3, full white. Keep their original dimensions and colors when repeating the test.

References: DKE panel specifications.